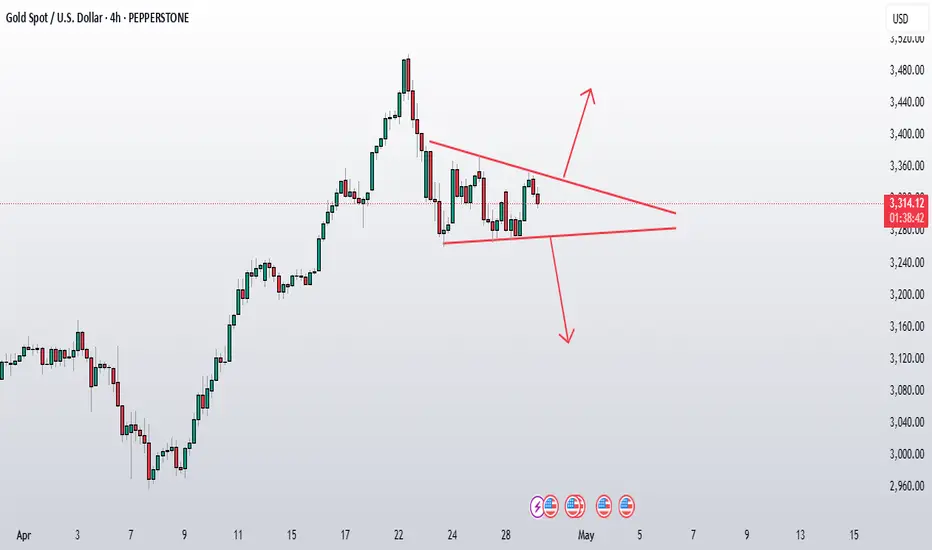
Gold price continues to exhibit a bearish short-term outlook, with price action remaining range-bound. As observed on the 4-hour chart shared today, gold is currently forming a triangle pattern, indicating a consolidation phase. The price is trading at 3146.13, still well below the golden Fibonacci zone (3380-3408), reinforcing that sellers maintain control.
The triangle pattern suggests an impending breakout, and the direction of the breakout will likely dictate the next significant move. Given the bearish context from ,my previous analysis supported by the weekly close below recent swing highs and the failure to reclaim the Fib zonemy bias remains toward a downward breakout.
If the price breaks below the triangle's lower trendline, it could test the key support at 3150-3165. A break below this level would likely accelerate the decline toward my target of 3000, as previously projected.
However, if gold breaks above the triangle's upper trendline, it could signal a potential short-term reversal, possibly retesting resistance around 3380. For now, I lean toward the bearish scenario, expecting lower levels to be tested soon unless a strong bullish sign appear outside of this range formation .
Nota
Going good✅For Live Update on Gold Price and trade opportunities ; Join Free community
t.me/livepriceactiontrading
t.me/livepriceactiontrading
Penerbitan berkaitan
Penafian
Maklumat dan penerbitan adalah tidak dimaksudkan untuk menjadi, dan tidak membentuk, nasihat untuk kewangan, pelaburan, perdagangan dan jenis-jenis lain atau cadangan yang dibekalkan atau disahkan oleh TradingView. Baca dengan lebih lanjut di Terma Penggunaan.
✅For Live Update on Gold Price and trade opportunities ; Join Free community
t.me/livepriceactiontrading
t.me/livepriceactiontrading
Penerbitan berkaitan
Penafian
Maklumat dan penerbitan adalah tidak dimaksudkan untuk menjadi, dan tidak membentuk, nasihat untuk kewangan, pelaburan, perdagangan dan jenis-jenis lain atau cadangan yang dibekalkan atau disahkan oleh TradingView. Baca dengan lebih lanjut di Terma Penggunaan.