GOLD | Elliot Wave | A Text Book Example?
It is extremely rare that in reality, we find patterns in textbook examples.
Gold is currently presenting such an opportunity which I will explain in detail.
According to Elliot's Wave theory, an impulsive wave is created by 5 waves.
3 of these waves are impulsive (1,3 and 5)
2 waves are corrective (2 and 4)
According to the books, each impulsive wave is composed of 5 waves of the lower degree that can be seen in the lower chart time frames.
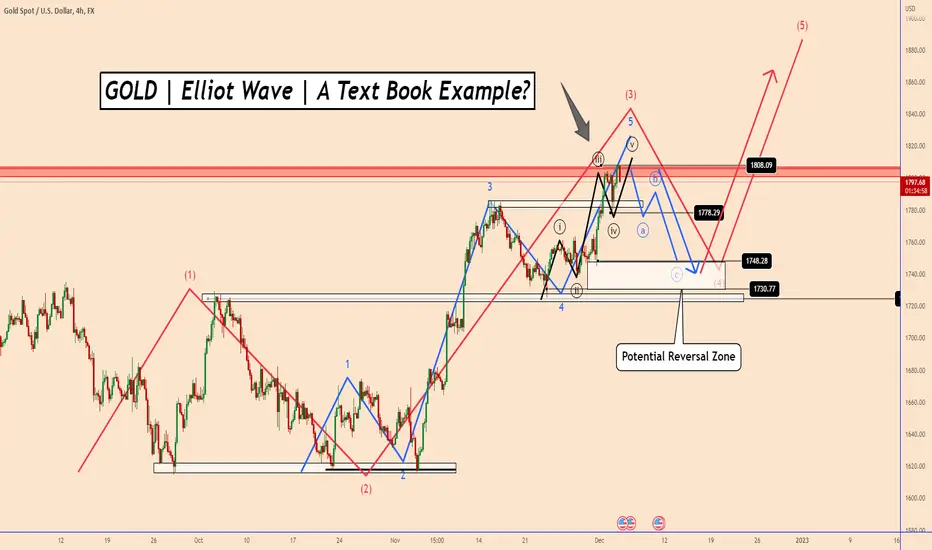
In our real-time example, the price has created the 3rd wave of a daily chart (in red). So it should be ready for the 4th wave correction.
If we look at the 4-hour chart, we can see that the 3rd wave can be broken down into 5 other waves (in blue)
And the 5th wave of the third wave (in blue) seems to be completed by 5 other waves (in black)
Maybe this is the moment we can see an ABC correction before the price goes up again for the 5th wave (in red).
The price correction zone is expected to be 1748 - 1730 in order for the price to rise again.
Thank you and Good Luck!
Daily Chart!

4-Hour chart:

It is extremely rare that in reality, we find patterns in textbook examples.
Gold is currently presenting such an opportunity which I will explain in detail.
According to Elliot's Wave theory, an impulsive wave is created by 5 waves.
3 of these waves are impulsive (1,3 and 5)
2 waves are corrective (2 and 4)
According to the books, each impulsive wave is composed of 5 waves of the lower degree that can be seen in the lower chart time frames.
In our real-time example, the price has created the 3rd wave of a daily chart (in red). So it should be ready for the 4th wave correction.
If we look at the 4-hour chart, we can see that the 3rd wave can be broken down into 5 other waves (in blue)
And the 5th wave of the third wave (in blue) seems to be completed by 5 other waves (in black)
Maybe this is the moment we can see an ABC correction before the price goes up again for the 5th wave (in red).
The price correction zone is expected to be 1748 - 1730 in order for the price to rise again.
Thank you and Good Luck!
Daily Chart!
4-Hour chart:
Nota
Nota
✅MY FREE Signals Channel
t.me/TradingPuzzles
✅Personal Telegram
t.me/KlejdiCuni
✅Suggested News Channel
t.me/ForexNewsNavigator_Official
t.me/TradingPuzzles
✅Personal Telegram
t.me/KlejdiCuni
✅Suggested News Channel
t.me/ForexNewsNavigator_Official
Penafian
Maklumat dan penerbitan adalah tidak bertujuan, dan tidak membentuk, nasihat atau cadangan kewangan, pelaburan, dagangan atau jenis lain yang diberikan atau disahkan oleh TradingView. Baca lebih dalam Terma Penggunaan.