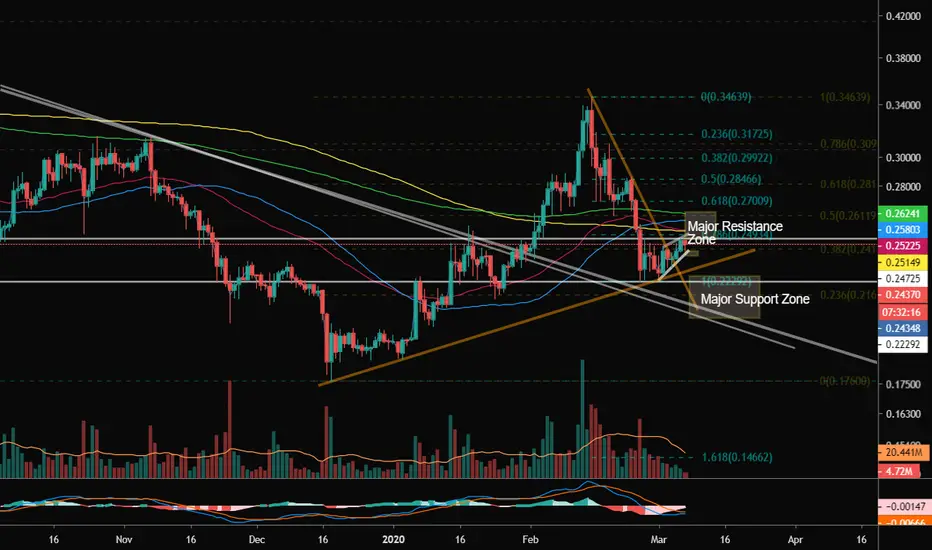
A bit messy, but went from top-down. After a quick top-down look at XRP, it has broken out of one downtrend this week on the daily timeframe... I have noticed a bearish volume divergence as it's tried to test the resistance areas above and it's created a rising wedge. It's held the support range from low .22-.23 and began consolidating after the large downtrend from the H&S break. High areas of .247 are the start of some decent resistance. We can see all that way up towards .26 will pose a challenge As You have the convergence of your 50-day SMA/ema and 200-day SMA/ema and some overlapping Fibonacci retracements in that range. If able to hold support, bulls have to break these areas or resistance and then ride up towards to 50-day averages on the weekly(which were the last decent highs). The volume needs to increase. Right now, the lack of volume and rising wedge are showing the bears have a little more control in the short term.
Penafian
Maklumat dan penerbitan adalah tidak dimaksudkan untuk menjadi, dan tidak membentuk, nasihat untuk kewangan, pelaburan, perdagangan dan jenis-jenis lain atau cadangan yang dibekalkan atau disahkan oleh TradingView. Baca dengan lebih lanjut di Terma Penggunaan.
Penafian
Maklumat dan penerbitan adalah tidak dimaksudkan untuk menjadi, dan tidak membentuk, nasihat untuk kewangan, pelaburan, perdagangan dan jenis-jenis lain atau cadangan yang dibekalkan atau disahkan oleh TradingView. Baca dengan lebih lanjut di Terma Penggunaan.