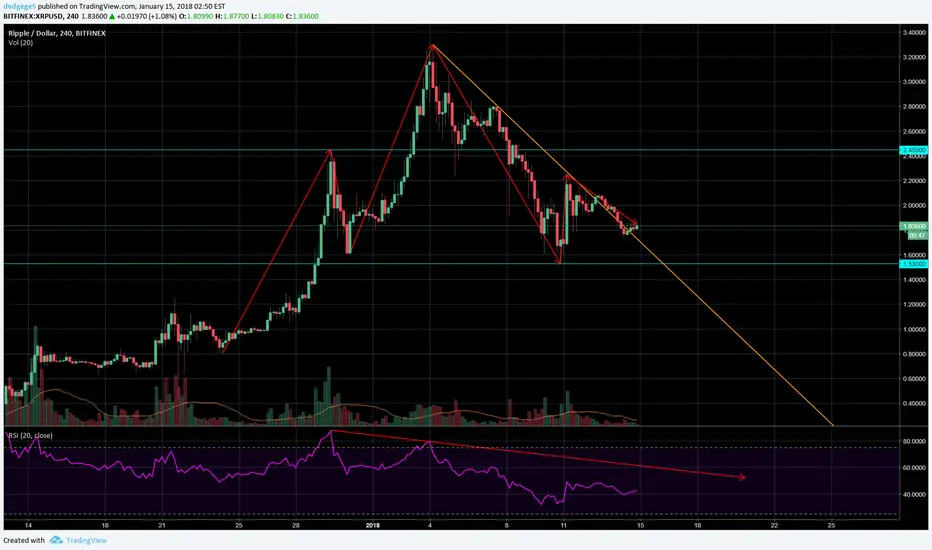
XRP has been bearish overall since its ATH 10 days ago. It hasn't managed a strong breakout from the trend (orange line), and volume has been very low. RSI showed bearish divergence at the peak.
Furthermore, XRP has also formed a head-and-shoulders pattern, meaning that it could see prices drop even further.
Currently hovering around $1.84, the direction that the price goes next will be very telling:
Furthermore, XRP has also formed a head-and-shoulders pattern, meaning that it could see prices drop even further.
Currently hovering around $1.84, the direction that the price goes next will be very telling:
- If the price continues downwards, and breaks $1.50 (previous low), then we will see the completion of the head and shoulders pattern, and a strong bearish signal.
- If it bounces off $1.50, forming a double-bottom pattern, giving a bullish signal.
- Lastly, it may break the current bearish trend altogether - but for this to happen, volume needs to pick up drastically. Watch for RSI to also break the bearish divergence trend line.
Nota
So for now, the trend continues. $1.50 was hit but not broken through convincingly.
Nota
In the previous update I used XRPUSDT on Bittrex instead of XRPUSD on Bitfinex. Oops. The prices are very similar, though, and I'll update again with XRPUSD soon.A look at XRPBTC. A similar H&S pattern. The previous "shoulder" was hit.
Nota
XRPUSD on Bitfinex again. $1.10 soon?
Nota
XRPBTC: the old support becomes the new resistance? Without a convincing breakout here, XRPBTC could be headed down even further
Nota
XRPUSD: still following the orange line
Nota
XRP looking much better today with a convincing trend break while BTC recovers as well. However, if BTC crashes further, XRP will follow suit, or at best, go sideways.
Nota
XRPBTC is inching closer to EMA50 and EMA200 death cross and as BTCUSD drops, XRPBTC is dropping along with it. Do not take a long position if you believe BTCUSD will drop even further.
Nota
XRPBTC is dancing around 12k, which was a previous support. Some more news of partnerships can potentially give it a much needed boost.
Nota
down we go again
Penafian
Maklumat dan penerbitan adalah tidak dimaksudkan untuk menjadi, dan tidak membentuk, nasihat untuk kewangan, pelaburan, perdagangan dan jenis-jenis lain atau cadangan yang dibekalkan atau disahkan oleh TradingView. Baca dengan lebih lanjut di Terma Penggunaan.
Penafian
Maklumat dan penerbitan adalah tidak dimaksudkan untuk menjadi, dan tidak membentuk, nasihat untuk kewangan, pelaburan, perdagangan dan jenis-jenis lain atau cadangan yang dibekalkan atau disahkan oleh TradingView. Baca dengan lebih lanjut di Terma Penggunaan.