OPEN-SOURCE SCRIPT
Trend Continuation Ratio
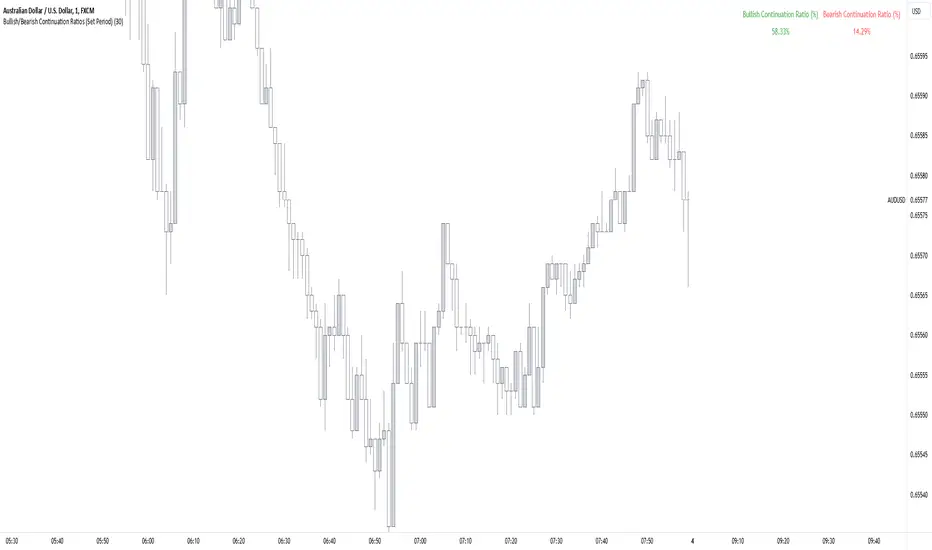
This TradingView indicator calculates the likelihood of consecutive bullish or bearish days over a specified period, giving insights into day-to-day continuation patterns within the market.
How It Works
Period Length Input:
Bullish and Bearish Day Definitions:
Count Tracking:
Bullish to Bullish Continuations: Counts each instance where a bullish day is followed by another bullish day.
Bearish to Bearish Continuations: Counts each instance where a bearish day is followed by another bearish day.
Calculating Continuation Ratios:
The Bullish Continuation Ratio is calculated as the percentage of bullish days that were followed by another bullish day:
Bullish Continuation Ratio = (Bullish to Bullish Continuations /Total Bullish Days)×100
Bullish Continuation Ratio=( Total Bullish Days/Bullish to Bullish Continuations )×100
The Bearish Continuation Ratio is the percentage of bearish days followed by another bearish day:
Bearish Continuation Ratio = (Bearish to Bearish Continuations/Total Bearish Days)×100
Bearish Continuation Ratio=( Total Bearish Days/Bearish to Bearish Continuations )×100
Display on Chart:
The indicator displays a table in the top-right corner of the chart with:
Usage Insights
This indicator is helpful for assessing short-term trend continuation tendencies, allowing traders to gauge whether they are more likely to see follow-through on bullish or bearish days within a chosen timeframe.
How It Works
Period Length Input:
- The user sets the period length (e.g., 20 days) to analyze.
- After each period, the counts reset, allowing fresh data for each new interval.
Bullish and Bearish Day Definitions:
- A day is considered bullish if the closing price is higher than the opening price.
- A day is considered bearish if the closing price is lower than the opening price.
Count Tracking:
- Within each specified period, the indicator tracks:
- Total Bullish Days: The number of days where the close is greater than the open.
- Total Bearish Days: The number of days where the close is less than the open.
Bullish to Bullish Continuations: Counts each instance where a bullish day is followed by another bullish day.
Bearish to Bearish Continuations: Counts each instance where a bearish day is followed by another bearish day.
Calculating Continuation Ratios:
The Bullish Continuation Ratio is calculated as the percentage of bullish days that were followed by another bullish day:
Bullish Continuation Ratio = (Bullish to Bullish Continuations /Total Bullish Days)×100
Bullish Continuation Ratio=( Total Bullish Days/Bullish to Bullish Continuations )×100
The Bearish Continuation Ratio is the percentage of bearish days followed by another bearish day:
Bearish Continuation Ratio = (Bearish to Bearish Continuations/Total Bearish Days)×100
Bearish Continuation Ratio=( Total Bearish Days/Bearish to Bearish Continuations )×100
Display on Chart:
The indicator displays a table in the top-right corner of the chart with:
- Bullish Continuation Ratio (%): Percentage of bullish days that led to another bullish day within the period.
- Bearish Continuation Ratio (%): Percentage of bearish days that led to another bearish day within the period.
Usage Insights
- High Ratios: If the bullish or bearish continuation ratio is high, it suggests a trend where bullish/bearish days often lead to similar days, indicating possible momentum.
- Low Ratios: Low continuation ratios indicate frequent reversals, which could suggest a range-bound or volatile market.
This indicator is helpful for assessing short-term trend continuation tendencies, allowing traders to gauge whether they are more likely to see follow-through on bullish or bearish days within a chosen timeframe.
Skrip sumber terbuka
Dalam semangat TradingView sebenar, pencipta skrip ini telah menjadikannya sumber terbuka, jadi pedagang boleh menilai dan mengesahkan kefungsiannya. Terima kasih kepada penulis! Walaupuan anda boleh menggunakan secara percuma, ingat bahawa penerbitan semula kod ini tertakluk kepada Peraturan Dalaman.
Penafian
Maklumat dan penerbitan adalah tidak bertujuan, dan tidak membentuk, nasihat atau cadangan kewangan, pelaburan, dagangan atau jenis lain yang diberikan atau disahkan oleh TradingView. Baca lebih dalam Terma Penggunaan.