OPEN-SOURCE SCRIPT
Telah dikemas kini Kaufman Efficiency Ratio-Based Risk Percentage
OVERVIEW
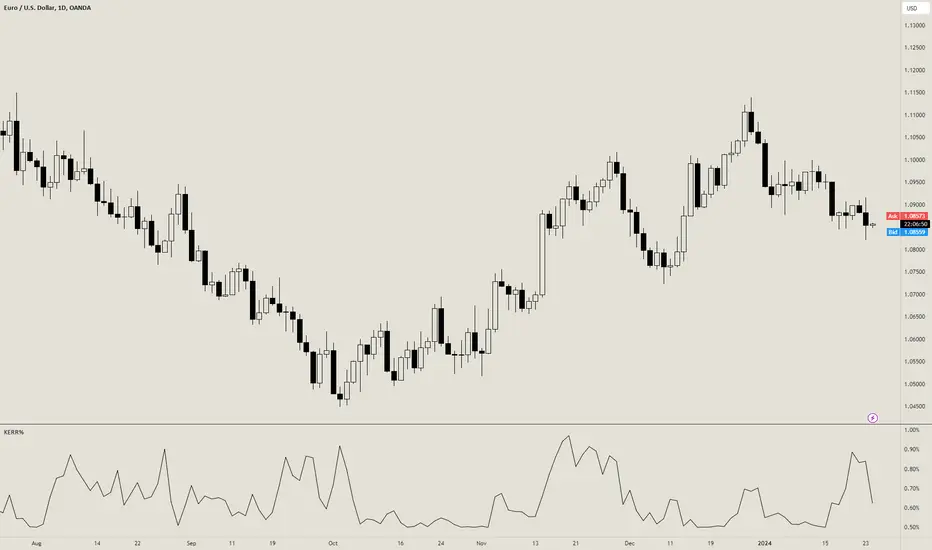
The Kaufman Efficiency Ratio-Based Exposure Management indicator uses the Kaufman Efficiency Ratio (KER) to calculate how much you should risk per trade.
If KER is high, then the indicator will tell you to risk more per trade.
If KER is low, then the indicator will tell you to risk less per trade.
CONCEPTS
The Kaufman Efficiency Ratio (also known as the Efficiency Ratio, KER, or ER) is a separate indicator developed by Perry J. Kaufman and first published in Kaufman's book, "New Trading Systems and Methods" in 1987.
The KER used to measure the efficiency of a financial instrument's price movement. It is calculated as follows:
KER = (change in price over x bars) / (sum of absolute price changes over x bars)
The first part of the formula, "change in price over x bars" measures the difference between the current close price and the close price x bars ago. The second part of the formula "sum of absolute price changes over x bars" measures the sum of the |open-close| range of each bar between now and x bars ago.
If there is a high change in price over x bars relative to the sum of absolute price changes over x bars, a trending/volatile market is likely in place.
If there is a low change in price over x bars relative to the sum of absolute price changes over x bars, a ranging/choppy market is likely in place.
If you are a trend trader, you can assume that entries taken during high KER periods are more likely to lead to a trend. This indicator helps capitalize on that assumption by increasing risk % per trade during high KER periods, and decreasing risk % per trade during low KER periods.
It uses the following formulas to calculate a KER-adjusted risk % per trade:
min risk = the smallest amount you'd be willing to risk on a trade
max risk = the largest amount you'd be willing to risk on a trade
KER = the current Kaufman Efficiency Ratio value
n = an exponent factor used to control the rate of increase of the risk %
Here is an example of how these formulas work:
Assuming that min risk is 0.5%, max risk is 2%, and KER is 0.8 (indicating a trending market), we can calculate the following risk per trade amounts:
Now, lets do the same calculations with a lower KER of 0.2, which indicates a choppy market:
With a high KER, we risk more per trade to capitalize on the higher chance of a trending market. With a lower KER, we risk less per trade to protect ourselves from the higher chance of a choppy market.
The Kaufman Efficiency Ratio-Based Exposure Management indicator uses the Kaufman Efficiency Ratio (KER) to calculate how much you should risk per trade.
If KER is high, then the indicator will tell you to risk more per trade.
- A high KER value indicates a trending market, so if you are a trend trader, it makes sense to risk more during these times.
If KER is low, then the indicator will tell you to risk less per trade.
- A low KER value indicates a trending market, so if you are a trend trader, it makes sense to risk less during these times.
CONCEPTS
The Kaufman Efficiency Ratio (also known as the Efficiency Ratio, KER, or ER) is a separate indicator developed by Perry J. Kaufman and first published in Kaufman's book, "New Trading Systems and Methods" in 1987.
The KER used to measure the efficiency of a financial instrument's price movement. It is calculated as follows:
KER = (change in price over x bars) / (sum of absolute price changes over x bars)
The first part of the formula, "change in price over x bars" measures the difference between the current close price and the close price x bars ago. The second part of the formula "sum of absolute price changes over x bars" measures the sum of the |open-close| range of each bar between now and x bars ago.
If there is a high change in price over x bars relative to the sum of absolute price changes over x bars, a trending/volatile market is likely in place.
If there is a low change in price over x bars relative to the sum of absolute price changes over x bars, a ranging/choppy market is likely in place.
If you are a trend trader, you can assume that entries taken during high KER periods are more likely to lead to a trend. This indicator helps capitalize on that assumption by increasing risk % per trade during high KER periods, and decreasing risk % per trade during low KER periods.
It uses the following formulas to calculate a KER-adjusted risk % per trade:
- Linearly-increasing risk % = min risk + (KER * (max risk - min risk))
- Exponentially-increasing risk % = min risk + ((KER^n) * (max risk - min risk))
min risk = the smallest amount you'd be willing to risk on a trade
max risk = the largest amount you'd be willing to risk on a trade
KER = the current Kaufman Efficiency Ratio value
n = an exponent factor used to control the rate of increase of the risk %
Here is an example of how these formulas work:
Assuming that min risk is 0.5%, max risk is 2%, and KER is 0.8 (indicating a trending market), we can calculate the following risk per trade amounts:
- Linearly-increasing risk % = 0.5 + (0.8 * (2 - 0.5)) = 1.7%
- Exponentially-increasing risk % = 0.5 + ((0.8^3) * (2 - 0.5)) = 1.27%
Now, lets do the same calculations with a lower KER of 0.2, which indicates a choppy market:
- Linearly-increasing risk % = 0.5 + (0.2 * (2 - 0.5)) = 0.8%
- Exponentially-increasing risk % = 0.5 + ((0.2^3) * (2 - 0.5)) = 0.51%
With a high KER, we risk more per trade to capitalize on the higher chance of a trending market. With a lower KER, we risk less per trade to protect ourselves from the higher chance of a choppy market.
Nota Keluaran
Minor cosmetic changes in input settingsNota Keluaran
Added option to invert the indicator's calculation.Skrip sumber terbuka
Dalam semangat sebenar TradingView, pencipta skrip ini telah menjadikannya sumber terbuka supaya pedagang dapat menilai dan mengesahkan kefungsiannya. Terima kasih kepada penulis! Walaupun anda boleh menggunakannya secara percuma, ingat bahawa menerbitkan semula kod ini adalah tertakluk kepada Peraturan Dalaman kami.
Penafian
Maklumat dan penerbitan adalah tidak dimaksudkan untuk menjadi, dan tidak membentuk, nasihat untuk kewangan, pelaburan, perdagangan dan jenis-jenis lain atau cadangan yang dibekalkan atau disahkan oleh TradingView. Baca dengan lebih lanjut di Terma Penggunaan.
Skrip sumber terbuka
Dalam semangat sebenar TradingView, pencipta skrip ini telah menjadikannya sumber terbuka supaya pedagang dapat menilai dan mengesahkan kefungsiannya. Terima kasih kepada penulis! Walaupun anda boleh menggunakannya secara percuma, ingat bahawa menerbitkan semula kod ini adalah tertakluk kepada Peraturan Dalaman kami.
Penafian
Maklumat dan penerbitan adalah tidak dimaksudkan untuk menjadi, dan tidak membentuk, nasihat untuk kewangan, pelaburan, perdagangan dan jenis-jenis lain atau cadangan yang dibekalkan atau disahkan oleh TradingView. Baca dengan lebih lanjut di Terma Penggunaan.