HOG Liquidity HunterHOG Liquidity Hunter – Pivot‑Based Liquidity Zones
📌 Overview
Plots dynamic support and resistance zones on swing pivots with an ATR‑based buffer. Anchored only when pivots are confirmed, the zones stay close to current price levels—ideal for spotting liquidity runs or traps.
🔧 How It Works
Detects swing highs and lows using ta.pivothigh() / ta.pivotlow() with a user‑defined lookback.
After a pivot is confirmed, calculates BSL/SSL zone = pivot ± (ATR * margin).
Zones update only on confirmed pivots—no repainting on open bars.
⚙️ Inputs
Lookback: bars to confirm pivots (e.g. 10–20).
ATR Margin Multiplier: buffer width (e.g. 1.25).
✅ Benefits
Structure‑focused: Zones align with real swing points.
Responsive yet stable: Tight ATR margin keeps zones precise, only updating on valid pivots.
Clean visuals: Two uncluttered zones—easy to interpret.
🛠 How to Use
Detect near‑zone bounce entries or exits on 4H/1D charts.
Combine with trend or volume indicators for stronger setups.
Use zones to identify potential stop‑run, liquidity re‑tests, or range turns.
⚠️ Notes & Disclaimers
Zones base off historical pivots; may lag until confirmed.
No future-looking data—relying entirely on closing bar confirmation.
Use alongside a complete trading framework; this is not a standalone signal.
Pivot

Previous Highs & Lows (Customizable)Previous Highs & Lows (Customizable)
This Pine Script indicator displays horizontal lines and labels for high, low, and midpoint levels across multiple timeframes. The indicator plots levels from the following periods:
Today's session high, low, and midpoint
Yesterday's high, low, and midpoint
Current week's high, low, and midpoint
Last week's high, low, and midpoint
Last month's high, low, and midpoint
Last quarter's high, low, and midpoint
Last year's high, low, and midpoint
Features
Individual Controls: Each timeframe has separate toggles for showing/hiding high/low levels and midpoint levels.
Custom Colors: Independent color selection for lines and labels for each timeframe group.
Display Options:
Adjustable line width (1-5 pixels)
Variable label text size (tiny, small, normal, large, huge)
Configurable label offset positioning
Organization: Settings are grouped by timeframe in a logical sequence from most recent (today) to least recent (last year).
Display Logic: Lines span the current trading day only. Labels are positioned to the right of the price action. The indicator automatically removes previous drawings to prevent chart clutter.

Gann Swing PointsIndicator Logic
This is a GANN-style swing indicator that classifies bars based on their high/low structure relative to the previous bar.
I strongly encourage you to replay bars on Tradingview using this indicator to get a sense of how it creates pivot (or swing) points
Bar Classification:
Up-Bar (direction: 'up'): Higher High and Higher Low (HH/HL)
Down-Bar (direction: 'down'): Lower High and Lower Low (LH/LL)
Outside-Bar (generates 2 directions):
Green: 'down' then 'up'
Red: 'up' then 'down'
Inside-Bar: No direction generated (HL/LH)
Swing Line Logic
The swing line continues in the current direction until n opposite directions are detected.
n is the "n-direction" parameter (commonly set to 2, so 2 consecutive opposite direction is needed to turn the swing)
When n opposing directions occur, the swing turns, creating a pivot point
Inside bar is ignored, so e.g up-bar -> inside-bar -> up-bar generates "up", "up" direction
A top pivot is formed when the swing turns down
A bottom pivot is formed when it turns up
Note: This swing logic is inherently lagging — it only confirms tops/bottoms after the fact
This swing structure gives the system a clear and noise-resistant way to identify pivot points (swing-points)

Auto AI Trendlines [TradingFinder] Clustering & Filtering Trends🔵 Introduction
Auto AI trendlines Clustering & Filtering Trends Indicator, draws a variety of trendlines. This auto plotting trendline indicator plots precise trendlines and regression lines, capturing trend dynamics.
Trendline trading is the strongest strategy in the financial market.
Regression lines, unlike trendlines, use statistical fitting to smooth price data, revealing trend slopes. Trendlines connect confirmed pivots, ensuring structural accuracy. Regression lines adapt dynamically.
The indicator’s ascending trendlines mark bullish pivots, while descending ones signal bearish trends. Regression lines extend in steps, reflecting momentum shifts. As the trend is your friend, this tool aligns traders with market flow.
Pivot-based trendlines remain fixed once confirmed, offering reliable support and resistance zones. Regression lines, adjusting to price changes, highlight short-term trend paths. Both are vital for traders across asset classes.
🔵 How to Use
There are four line types that are seen in the image below; Precise uptrend (green) and downtrend (red) lines connect exact price extremes, while Pivot-based uptrend and downtrend lines use significant swing points, both remaining static once formed.
🟣 Precise Trendlines
Trendlines only form after pivot points are confirmed, ensuring reliability. This reduces false signals in choppy markets. Regression lines complement with real-time updates.
The indicator always draws two precise trendlines on confirmed pivot points, one ascending and one descending. These are colored distinctly to mark bullish and bearish trends. They remain fixed, serving as structural anchors.
🟣 Dynamic Regression Lines
Regression lines, adjusting dynamically with price, reflect the latest trend slope for real-time analysis. Use these to identify trend direction and potential reversals.
Regression lines, updated dynamically, reflect real-time price trends and extend in steps. Ascending lines are green, descending ones orange, with shades differing from trendlines. This aids visual distinction.
🟣 Bearish Chart
A Bullish State emerges when uptrend lines outweigh or match downtrend lines, with recent upward momentum signaling a potential rise. Check the trend count in the state table to confirm, using it to plan long positions.
🟣 Bullish Chart
A Bearish State is indicated when downtrend lines dominate or equal uptrend lines, with recent downward moves suggesting a potential drop. Review the state table’s trend count to verify, guiding short position entries. The indicator reflects this shift for strategic planning.
🟣 Alarm
Set alerts for state changes to stay informed of Bullish or Bearish shifts without constant monitoring. For example, a transition to Bullish State may signal a buying opportunity. Toggle alerts On or Off in the settings.
🟣 Market Status
A table summarizes the chart’s status, showing counts of ascending and descending lines. This real-time overview simplifies trend monitoring. Check it to assess market bias instantly.
Monitor the table to track line counts and trend dominance.
A higher count of ascending lines suggests bullish bias. This helps traders align with the prevailing trend.
🔵 Settings
Number of Trendlines : Sets total lines (max 10, min 3), balancing chart clarity and trend coverage.
Max Look Back : Defines historical bars (min 50) for pivot detection, ensuring robust trendlines.
Pivot Range : Sets pivot sensitivity (min 2), adjusting trendline precision to market volatility.
Show Table Checkbox : Toggles display of a table showing ascending/descending line counts.
Alarm : Enable or Disable the alert.
🔵 Conclusion
The multi slopes indicator, blending pivot-based trendlines and dynamic regression lines, maps market trends with precision. Its dual approach captures both structural and short-term momentum.
Customizable settings, like trendline count and pivot range, adapt to diverse trading styles. The real-time table simplifies trend monitoring, enhancing efficiency. It suits forex, stocks, and crypto markets.
While trendlines anchor long-term trends, regression lines track intraday shifts, offering versatility. Contextual analysis, like price action, boosts signal reliability. This indicator empowers data-driven trading decisions.

Vietnamese Market Structure With CountersThis indicator is designed to track Market Structure with Swing-Low Breakdowns and Swing-High Breakups specifically tailored for the Vietnamese stock market, though it can be applied elsewhere too. By default, it uses a 10-period EMA to dynamically detect key turning points in price action and count significant breakdowns or breakups from previous swing levels.
As an open source, you can modify the source code to match your needs.
What it does:
Detects when price breaks below previous swing lows or above previous swing highs.
Plots swing levels for both highs and lows.
Displays labeled counters on the chart to show how many consecutive breakdowns or breakups have occurred.
Helps traders identify trend shifts and possible exhaustion in moves.
Why it's useful:
This tool is great for visually tracking market momentum and structure changes — especially in trending or volatile environments. It emphasizes structure over indicators, helping you understand price behavior in a simplified, intuitive way.
License:
This script is published under the Mozilla Public License 2.0. Feel free to use, modify, and contribute!
Created with care by @doqkhanh.
If you find it useful, consider leaving a comment or sharing it with others!

Liquidity Trap Reversal Pro (Radar v2)Liquidity Trap Reversal Pro (Radar v2) is a non-repainting indicator designed to detect hidden liquidity traps at key swing highs and lows. It combines wick analysis, volume spike detection, and optional trend and exhaustion filters to identify high-probability reversal setups.
🔷 Features:
Non-Repainting: Pivots confirmed after lookback period, no future leaking.
Volume Spike Detection: Filters traps that occur during major liquidity events.
EMA Trend Filter (Optional): Focus on traps aligned with the prevailing trend.
Higher Timeframe Trend Filter (Optional): Confirm traps using a higher timeframe EMA bias.
Exhaustion Guard (Optional): Prevents traps after overextended moves based on ATR stretch.
Clean Visuals: Distinct plots for raw trap points vs confirmed traps.
Alerts Included: Set alerts for confirmed high/low liquidity traps.
📚 How to Use:
Watch for Trap Signals:
A Trap High signal suggests a potential bearish reversal.
A Trap Low signal suggests a potential bullish reversal.
Use Confirmed Signals for Best Entries:
Confirmed traps fire only after price moves opposite to the trap direction, adding reliability.
Use Trend Filters to Improve Accuracy:
In an uptrend (price above EMA), prefer Trap Lows (buy setups).
In a downtrend (price below EMA), prefer Trap Highs (sell setups).
Use the Exhaustion Guard to Avoid Bad Trades:
This filter blocks signals when price has moved too far from trend, helping avoid late entries.
Recommended Settings:
Best used on 15-minute, 1-hour, or 4-hour charts.
Trend filter ON for trending markets.
Exhaustion guard ON for volatile or stretched markets.
📈 Important Notes:
This script does not repaint once a pivot is confirmed.
Alerts trigger only on confirmed trap signals.
Always combine signals with sound risk management and trading strategy.
Disclaimer:
This script is for educational purposes only. It is not investment advice or a guarantee of results. Always do your own research before trading.

Probability Grid [LuxAlgo]The Probability Grid tool allows traders to see the probability of where and when the next reversal would occur, it displays a 10x10 grid and/or dashboard with the probability of the next reversal occurring beyond each cell or within each cell.
🔶 USAGE
By default, the tool displays deciles (percentiles from 0 to 90), users can enable, disable and modify each percentile, but two of them must always be enabled or the tool will display an error message alerting of it.
The use of the tool is quite simple, as shown in the chart above, the further the price moves on the grid, the higher the probability of a reversal.
In this case, the reversal took place on the cell with a probability of 9%, which means that there is a probability of 91% within the square defined by the last reversal and this cell.
🔹 Grid vs Dashboard
The tool can display a grid starting from the last reversal and/or a dashboard at three predefined locations, as shown in the chart above.
🔶 DETAILS
🔹 Raw Data vs Normalized Data
By default the tool displays the normalized data, this means that instead of using the raw data (price delta between reversals) it uses the returns between each reversal, this is useful to make an apples to apples comparison of all the data in the dataset.
This can be seen in the left side of the chart above (BTCUSD Daily chart) where normalize data is disabled, the percentiles from 0 to 40 overlap and are indistinguishable from each other because the tool uses the raw price delta over the entire bitcoin history, with normalize data enabled as we can see in the right side of the chart we can have a fair comparison of the data over the entire history.
🔹 Probability Beyond or Within Each Cell
Two different probability modes are available, the default mode is Probability Beyond Each Cell, the number displayed in each cell is the probability of the next reversal to be located in the area beyond the cell, for example, if the cell displays 20%, it means that in the area formed by the square starting from the last reversal and ending at the cell, there is an 80% probability and outside that square there is a 20% probability for the location of the next reversal.
The second probability mode is the probability within each cell, this outlines the chance that the next reversal will be within the cell, as we can see on the right chart above, when using deciles as percentiles (default settings), each cell has the same 1% probability for the 10x10 grid.
🔶 SETTINGS
Swing Length: The maximum length in bars used to identify a swing
Maximum Reversals: Maximum number of reversals included in calculations
Normalize Data: Use returns between swings instead of raw price
Probability: Choose between two different probability modes: beyond and inside each cell
Percentiles: Enable/disable each of the ten percentiles and select the percentile number and line style
🔹 Dashboard
Show Dashboard: Enable or disable the dashboard
Position: Choose dashboard location
Size: Choose dashboard size
🔹 Style
Show Grid: Enable or disable the grid
Size: Choose grid text size
Colors: Choose grid background colors
Show Marks: Enable/disable reversal markers

StatPivot- Dynamic Range Analyzer - indicator [PresentTrading]Hello everyone! In the following few open scripts, I would like to share various statistical tools that benefit trading. For this time, it is a powerful indicator called StatPivot- Dynamic Range Analyzer that brings a whole new dimension to your technical analysis toolkit.
This tool goes beyond traditional pivot point analysis by providing comprehensive statistical insights about price movements, helping you identify high-probability trading opportunities based on historical data patterns rather than subjective interpretations. Whether you're a day trader, swing trader, or position trader, StatPivot's real-time percentile rankings give you a statistical edge in understanding exactly where current price action stands within historical contexts.
Welcome to share your opinions! Looking forward to sharing the next tool soon!
█ Introduction and How it is Different
StatPivot is an advanced technical analysis tool that revolutionizes retracement analysis. Unlike traditional pivot indicators that only show static support/resistance levels, StatPivot delivers dynamic statistical insights based on historical pivot patterns.
Its key innovation is real-time percentile calculation - while conventional tools require new pivot formations before updating (often too late for trading decisions), StatPivot continuously analyzes where current price stands within historical retracement distributions.
Furthermore, StatPivot provides comprehensive statistical metrics including mean, median, standard deviation, and percentile distributions of price movements, giving traders a probabilistic edge by revealing which price levels represent statistically significant zones for potential reversals or continuations. By transforming raw price data into statistical insights, StatPivot helps traders move beyond subjective price analysis to evidence-based decision making.
█ Strategy, How it Works: Detailed Explanation
🔶 Pivot Point Detection and Analysis
The core of StatPivot's functionality begins with identifying significant pivot points in the price structure. Using the parameters left and right, the indicator locates pivot highs and lows by examining a specified number of bars to the left and right of each potential pivot point:
Copyp_low = ta.pivotlow(low, left, right)
p_high = ta.pivothigh(high, left, right)
For a point to qualify as a pivot low, it must have left higher lows to its left and right higher lows to its right. Similarly, a pivot high must have left lower highs to its left and right lower highs to its right. This approach ensures that only significant turning points are recognized.
🔶 Percentage Change Calculation
Once pivot points are identified, StatPivot calculates the percentage changes between consecutive pivot points:
For drops (when a pivot low is lower than the previous pivot low):
CopydropPercent = (previous_pivot_low - current_pivot_low) / previous_pivot_low * 100
For rises (when a pivot high is higher than the previous pivot high):
CopyrisePercent = (current_pivot_high - previous_pivot_high) / previous_pivot_high * 100
These calculations quantify the magnitude of each market swing, allowing for statistical analysis of historical price movements.
🔶 Statistical Distribution Analysis
StatPivot computes comprehensive statistics on the historical distribution of drops and rises:
Average (Mean): The arithmetic mean of all recorded percentage changes
CopyavgDrop = array.avg(dropValues)
Median: The middle value when all percentage changes are arranged in order
CopymedianDrop = array.median(dropValues)
Standard Deviation: Measures the dispersion of percentage changes from the average
CopystdDevDrop = array.stdev(dropValues)
Percentiles (25th, 75th): Values below which 25% and 75% of observations fall
Copyq1 = array.get(sorted, math.floor(cnt * 0.25))
q3 = array.get(sorted, math.floor(cnt * 0.75))
VaR95: The maximum expected percentage drop with 95% confidence
Copyvar95D = array.get(sortedD, math.floor(nD * 0.95))
Coefficient of Variation (CV): Measures relative variability
CopycvD = stdDevDrop / avgDrop
These statistics provide a comprehensive view of market behavior, enabling traders to understand the typical ranges and extreme moves.
🔶 Real-time Percentile Ranking
StatPivot's most innovative feature is its real-time percentile calculation. For each current price, it calculates:
The percentage drop from the latest pivot high:
CopycurrentDropPct = (latestPivotHigh - close) / latestPivotHigh * 100
The percentage rise from the latest pivot low:
CopycurrentRisePct = (close - latestPivotLow) / latestPivotLow * 100
The percentile ranks of these values within the historical distribution:
CopyrealtimeDropRank = (count of historical drops <= currentDropPct) / total drops * 100
This calculation reveals exactly where the current price movement stands in relation to all historical movements, providing crucial context for decision-making.
🔶 Cluster Analysis
To identify the most common retracement zones, StatPivot performs a cluster analysis by dividing the range of historical drops into five equal intervals:
CopyrangeSize = maxVal - minVal
For each interval boundary:
Copyboundaries = minVal + rangeSize * i / 5
By counting the number of observations in each interval, the indicator identifies the most frequently occurring retracement zones, which often serve as significant support or resistance areas.
🔶 Expected Price Targets
Using the statistical data, StatPivot calculates expected price targets:
CopytargetBuyPrice = close * (1 - avgDrop / 100)
targetSellPrice = close * (1 + avgRise / 100)
These targets represent statistically probable price levels for potential entries and exits based on the average historical behavior of the market.
█ Trade Direction
StatPivot functions as an analytical tool rather than a direct trading signal generator, providing statistical insights that can be applied to various trading strategies. However, the data it generates can be interpreted for different trade directions:
For Long Trades:
Entry considerations: Look for price drops that reach the 70-80th percentile range in the historical distribution, suggesting a statistically significant retracement
Target setting: Use the Expected Sell price or consider the average rise percentage as a reasonable target
Risk management: Set stop losses below recent pivot lows or at a distance related to the statistical volatility (standard deviation)
For Short Trades:
Entry considerations: Look for price rises that reach the 70-80th percentile range, indicating an unusual extension
Target setting: Use the Expected Buy price or average drop percentage as a target
Risk management: Set stop losses above recent pivot highs or based on statistical measures of volatility
For Range Trading:
Use the most common drop and rise clusters to identify probable reversal zones
Trade bounces between these statistically significant levels
For Trend Following:
Confirm trend strength by analyzing consecutive higher pivot lows (uptrend) or lower pivot highs (downtrend)
Use lower percentile retracements (20-30th percentile) as entry opportunities in established trends
█ Usage
StatPivot offers multiple ways to integrate its statistical insights into your trading workflow:
Statistical Table Analysis: Review the comprehensive statistics displayed in the data table to understand the market's behavior. Pay particular attention to:
Average drop and rise percentages to set reasonable expectations
Standard deviation to gauge volatility
VaR95 for risk assessment
Real-time Percentile Monitoring: Watch the real-time percentile display to see where the current price movement stands within the historical distribution. This can help identify:
Extreme movements (90th+ percentile) that might indicate reversal opportunities
Typical retracements (40-60th percentile) that might continue further
Shallow pullbacks (10-30th percentile) that might represent continuation opportunities in trends
Support and Resistance Identification: Utilize the plotted pivot points as key support and resistance levels, especially when they align with statistically significant percentile ranges.
Target Price Setting: Use the expected buy and sell prices calculated from historical averages as initial targets for your trades.
Risk Management: Apply the statistical measurements like standard deviation and VaR95 to set appropriate stop loss levels that account for the market's historical volatility.
Pattern Recognition: Over time, learn to recognize when certain percentile levels consistently lead to reversals or continuations in your specific market, and develop personalized strategies based on these observations.
█ Default Settings
The default settings of StatPivot have been carefully calibrated to provide reliable statistical analysis across a variety of markets and timeframes, but understanding their effects allows for optimal customization:
Left Bars (30) and Right Bars (30): These parameters determine how pivot points are identified. With both set to 30 by default:
A pivot low must be the lowest point among 30 bars to its left and 30 bars to its right
A pivot high must be the highest point among 30 bars to its left and 30 bars to its right
Effect on performance: Larger values create fewer but more significant pivot points, reducing noise but potentially missing important market structures. Smaller values generate more pivot points, capturing more nuanced movements but potentially including noise.
Table Position (Top Right): Determines where the statistical data table appears on the chart.
Effect on performance: No impact on analytical performance, purely a visual preference.
Show Distribution Histogram (False): Controls whether the distribution histogram of drop percentages is displayed.
Effect on performance: Enabling this provides visual insight into the distribution of retracements but can clutter the chart.
Show Real-time Percentile (True): Toggles the display of real-time percentile rankings.
Effect on performance: A critical setting that enables the dynamic analysis of current price movements. Disabling this removes one of the key advantages of the indicator.
Real-time Percentile Display Mode (Label): Chooses between label display or indicator line for percentile rankings.
Effect on performance: Labels provide precise information at the current price point, while indicator lines show the evolution of percentile rankings over time.
Advanced Considerations for Settings Optimization:
Timeframe Adjustment: Higher timeframes generally benefit from larger Left/Right values to identify truly significant pivots, while lower timeframes may require smaller values to capture shorter-term swings.
Volatility-Based Tuning: In highly volatile markets, consider increasing the Left/Right values to filter out noise. In less volatile conditions, lower values can help identify more potential entry and exit points.
Market-Specific Optimization: Different markets (forex, stocks, commodities) display different retracement patterns. Monitor the statistics table to see if your market typically shows larger or smaller retracements than the current settings are optimized for.
Trading Style Alignment: Adjust the settings to match your trading timeframe. Day traders might prefer settings that identify shorter-term pivots (smaller Left/Right values), while swing traders benefit from more significant pivots (larger Left/Right values).
By understanding how these settings affect the analysis and customizing them to your specific market and trading style, you can maximize the effectiveness of StatPivot as a powerful statistical tool for identifying high-probability trading opportunities.

Fibonacci - DolphinTradeBot
OVERVIEW
The 'Fibonacci - DolphinTradeBot' indicator is a Pine Script-based tool for TradingView that dynamically identifies key Fibonacci retracement levels using ZigZag price movements. It aims to replicate the Fibonacci Retracement tool available in TradingView’s drawing tools. The indicator calculates Fibonacci levels based on directional price changes, marking critical retracement zones such as 0, 0.236, 0.382, 0.5, 0.618, 0.786, and 1.0 on the chart. These levels are visualized with lines and labels, providing traders with precise areas of potential price reversals or trend continuation.
HOW IT WORKS ?
The indicator follows a zigzag formation. After a large swing movement, when new swings are formed without breaking the upper and lower levels, it places Fibonacci levels at the beginning and end points of the major swing movement."
▪️(Bullish) Structure :High → HigherLow → LowerHigh
▪️(Bearish) Structure :Low → LowerHigh → HigherLow
▪️When Fibonacci retracement levels are determined, a "📌" mark appears on the chart.
▪️If the price closes outside of these levels, a "❌" mark will appear.
USAGE
This indicator is designed to plot Fibonacci levels within an accumulation zone following significant price movements, helping you identify potential support and resistance. You can adjust the pivot periods to customize the zigzag settings to your preference. While classic Fibonacci levels are used by default, you also have the option to input custom levels and assign your preferred colors.
Set the Fibonacci direction option to "upward" to detect only bullish structures, "downward" to detect only bearish structures, and "both" to see both at the same time.
"To view past levels, simply enable the ' Show Previous Levels ' option, and to display the zigzag lines, activate the ' Show Zigzag ' setting."
ALERTS
The indicator, by default, triggers an alarm when both a level is formed and when a level is broken. However, if you'd like, you can select the desired level from the " Select Level " section in the indicator settings and set the alarm based on one of the conditions below.
▪️ cross-up → If the price breaks the Fibonacci level to the upside.
▪️ cross-down → If the price breaks the Fibonacci level to the downside.
▪️ cross-any → If the price breaks the Fibonacci level in any direction.

Quarterly Theory ICT 03 [TradingFinder] Precision Swing Points🔵 Introduction
Precision Swing Point (PSP) is a divergence pattern in the closing of candles between two correlated assets, which can indicate a potential trend reversal. This structure appears at market turning points and highlights discrepancies between the price behavior of two related assets.
PSP typically forms in key timeframes such as 5-minute, 15-minute, and 90-minute charts, and is often used in combination with Smart Money Concepts (SMT) to confirm trade entries.
PSP is categorized into Bearish PSP and Bullish PSP :
Bearish PSP : Occurs when an asset breaks its previous high, and its middle candle closes bullish, while the correlated asset closes bearish at the same level. This divergence signals weakness in the uptrend and a potential price reversal downward.
Bullish PSP : Occurs when an asset breaks its previous low, and its middle candle closes bearish, while the correlated asset closes bullish at the same level. This suggests weakness in the downtrend and a potential price increase.
🟣 Trading Strategies Using Precision Swing Point (PSP)
PSP can be integrated into various trading strategies to improve entry accuracy and filter out false signals. One common method is combining PSP with SMT (divergence between correlated assets), where traders identify divergence and enter a trade only after PSP confirms the move.
Additionally, PSP can act as a liquidity gap, meaning that price tends to react to the wick of the PSP candle, making it a favorable entry point with a tight stop-loss and high risk-to-reward ratio. Furthermore, PSP combined with Order Blocks and Fair Value Gaps in higher timeframes allows traders to identify stronger reversal zones.
In lower timeframes, such as 5-minute or 15-minute charts, PSP can serve as a confirmation for more precise entries in the direction of the higher timeframe trend. This is particularly useful in scalping and intraday trading, helping traders execute smarter entries while minimizing unnecessary stop-outs.
🔵 How to Use
PSP is a trading pattern based on divergence in candle closures between two correlated assets. This divergence signals a difference in trend strength and can be used to identify precise market turning points. PSP is divided into Bullish PSP and Bearish PSP, each applicable for long and short trades.
🟣 Bullish PSP
A Bullish PSP forms when, at a market turning point, the middle candle of one asset closes bearish while the correlated asset closes bullish. This discrepancy indicates weakness in the downtrend and a potential price reversal upward.
Traders can use this as a signal for long (buy) trades. The best approach is to wait for price to return to the wick of the PSP candle, as this area typically acts as a liquidity level.
f PSP forms within an Order Block or Fair Value Gap in a higher timeframe, its reliability increases, allowing for entries with tight stop-loss and optimal risk-to-reward ratios.
🟣 Bearish PSP
A Bearish PSP forms when, at a market turning point, the middle candle of one asset closes bullish while the correlated asset closes bearish. This indicates weakness in the uptrend and a potential price decline.
Traders use this pattern to enter short (sell) trades. The best entry occurs when price retests the wick of the PSP candle, as this level often acts as a resistance zone, pushing price lower.
If PSP aligns with a significant liquidity area or Order Block in a higher timeframe, traders can enter with greater confidence and place their stop-loss just above the PSP wick.
Overall, PSP is a highly effective tool for filtering false signals and improving trade entry precision. Combining PSP with SMT, Order Blocks, and Fair Value Gaps across multiple timeframes allows traders to execute higher-accuracy trades with lower risk.
🔵 Settings
Mode :
2 Symbol : Identifies PSP and PCP between two correlated assets.
3 Symbol : Compares three assets to detect more complex divergences and stronger confirmation signals.
Second Symbol : The second asset used in PSP and correlation calculations.
Third Symbol : Used in three-symbol mode for deeper PSP and PCP analysis.
Filter Precision X Point : Enables or disables filtering for more precise PSP and PCP detection. This filter only identifies PSP and PCP when the base asset's candle qualifies as a Pin Bar.
Trend Effect : By changing the Trend Effect status to "Off," all Pin bars, whether bullish or bearish, are displayed regardless of the current market trend. If the status remains "On," only Pin bars in the direction of the main market trend are shown.
Bullish Pin Bar Setting : Using the "Ratio Lower Shadow to Body" and "Ratio Lower Shadow to Higher Shadow" settings, you can customize your bullish Pin bar candles. Larger numbers impose stricter conditions for identifying bullish Pin bars.
Bearish Pin Bar Setting : Using the "Ratio Higher Shadow to Body" and "Ratio Higher Shadow to Lower Shadow" settings, you can customize your bearish Pin bar candles. Larger numbers impose stricter conditions for identifying bearish Pin bars.
🔵 Conclusion
Precision Swing Point (PSP) is a powerful analytical tool in Smart Money trading strategies, helping traders identify precise market turning points by detecting divergences in candle closures between correlated assets. PSP is classified into Bullish PSP and Bearish PSP, each playing a crucial role in detecting trend weaknesses and determining optimal entry points for long and short trades.
Using the PSP wick as a key liquidity level, integrating it with SMT, Order Blocks, and Fair Value Gaps, and analyzing higher timeframes are effective techniques to enhance trade entries. Ultimately, PSP serves as a complementary tool for improving entry accuracy and reducing unnecessary stop-outs, making it a valuable addition to Smart Money trading methodologies.

Rally Base Drop SND Pivots Strategy [LuxAlgo X PineIndicators]This strategy is based on the Rally Base Drop (RBD) SND Pivots indicator developed by LuxAlgo. Full credit for the concept and original indicator goes to LuxAlgo.
The Rally Base Drop SND Pivots Strategy is a non-repainting supply and demand trading system that detects pivot points based on Rally, Base, and Drop (RBD) candles. This strategy automatically identifies key market structure levels, allowing traders to:
Identify pivot-based supply and demand (SND) zones.
Use fixed criteria for trend continuation or reversals.
Filter out market noise by requiring structured price formations.
Enter trades based on breakouts of key SND pivot levels.
How the Rally Base Drop SND Pivots Strategy Works
1. Pivot Point Detection Using RBD Candles
The strategy follows a rigid market structure methodology, where pivots are detected only when:
A Rally (R) consists of multiple consecutive bullish candles.
A Drop (D) consists of multiple consecutive bearish candles.
A Base (B) is identified as a transition between Rallies and Drops, acting as a pivot point.
The pivot level is confirmed when the formation is complete.
Unlike traditional fractal-based pivots, RBD Pivots enforce stricter structural rules, ensuring that each pivot:
Has a well-defined bullish or bearish price movement.
Reduces false signals caused by single-bar fluctuations.
Provides clear supply and demand levels based on structured price movements.
These pivot levels are drawn on the chart using color-coded boxes:
Green zones represent bullish pivot levels (Rally Base formations).
Red zones represent bearish pivot levels (Drop Base formations).
Once a pivot is confirmed, the high or low of the base candle is used as the reference level for future trades.
2. Trade Entry Conditions
The strategy allows traders to select from three trading modes:
Long Only – Only takes long trades when bullish pivot breakouts occur.
Short Only – Only takes short trades when bearish pivot breakouts occur.
Long & Short – Trades in both directions based on pivot breakouts.
Trade entry signals are triggered when price breaks through a confirmed pivot level:
Long Entry:
A bullish pivot level is formed.
Price breaks above the bullish pivot level.
The strategy enters a long position.
Short Entry:
A bearish pivot level is formed.
Price breaks below the bearish pivot level.
The strategy enters a short position.
The strategy includes an optional mode to reverse long and short conditions, allowing traders to experiment with contrarian entries.
3. Exit Conditions Using ATR-Based Risk Management
This strategy uses the Average True Range (ATR) to calculate dynamic stop-loss and take-profit levels:
Stop-Loss (SL): Placed 1 ATR below entry for long trades and 1 ATR above entry for short trades.
Take-Profit (TP): Set using a Risk-Reward Ratio (RR) multiplier (default = 6x ATR).
When a trade is opened:
The entry price is recorded.
ATR is calculated at the time of entry to determine stop-loss and take-profit levels.
Trades exit automatically when either SL or TP is reached.
If reverse conditions mode is enabled, stop-loss and take-profit placements are flipped.
Visualization & Dynamic Support/Resistance Levels
1. Pivot Boxes for Market Structure
Each pivot is marked with a colored box:
Green boxes indicate bullish demand zones.
Red boxes indicate bearish supply zones.
These boxes remain on the chart to act as dynamic support and resistance levels, helping traders identify key price reaction zones.
2. Horizontal Entry, Stop-Loss, and Take-Profit Lines
When a trade is active, the strategy plots:
White line → Entry price.
Red line → Stop-loss level.
Green line → Take-profit level.
Labels display the exact entry, SL, and TP values, updating dynamically as price moves.
Customization Options
This strategy offers multiple adjustable settings to optimize performance for different market conditions:
Trade Mode Selection → Choose between Long Only, Short Only, or Long & Short.
Pivot Length → Defines the number of required Rally & Drop candles for a pivot.
ATR Exit Multiplier → Adjusts stop-loss distance based on ATR.
Risk-Reward Ratio (RR) → Modifies take-profit level relative to risk.
Historical Lookback → Limits how far back pivot zones are displayed.
Color Settings → Customize pivot box colors for bullish and bearish setups.
Considerations & Limitations
Pivot Breakouts Do Not Guarantee Reversals. Some pivot breaks may lead to continuation moves instead of trend reversals.
Not Optimized for Low Volatility Conditions. This strategy works best in trending markets with strong momentum.
ATR-Based Stop-Loss & Take-Profit May Require Optimization. Different assets may require different ATR multipliers and RR settings.
Market Noise May Still Influence Pivots. While this method filters some noise, fake breakouts can still occur.
Conclusion
The Rally Base Drop SND Pivots Strategy is a non-repainting supply and demand system that combines:
Pivot-based market structure analysis (using Rally, Base, and Drop candles).
Breakout-based trade entries at confirmed SND levels.
ATR-based dynamic risk management for stop-loss and take-profit calculation.
This strategy helps traders:
Identify high-probability supply and demand levels.
Trade based on structured market pivots.
Use a systematic approach to price action analysis.
Automatically manage risk with ATR-based exits.
The strict pivot detection rules and built-in breakout validation make this strategy ideal for traders looking to:
Trade based on market structure.
Use defined support & resistance levels.
Reduce noise compared to traditional fractals.
Implement a structured supply & demand trading model.
This strategy is fully customizable, allowing traders to adjust parameters to fit their market and trading style.
Full credit for the original concept and indicator goes to LuxAlgo.

Rally Base Drop SND Pivots [LuxAlgo]The Rally Base Drop SND Pivots indicator uses "Rally", "Base", and "Drop" Candles to determine pivot points at which supply and demand (SND) levels are drawn.
🔶 USAGE
Rally, Base, and Drop (RBD) candles create a formula for seeing market structure through a fixed methodology. We are able to use this concept to point out pivot areas where Rallies and Drops directly meet.
The RBD SND Pivots are similar to traditionally identified "fractal" pivot points, with one key difference.
RBD SND Pivots detect a specific number of Rally and Drop candles directly back-to-back, requiring one side of the pivot to contain entirely green candles and the other to be entirely red candles or vice versa.
Since these pivot levels are based on Rally, Base, and Drop candles, the method directly implements rigid logic to further structure a trading system when utilizing these pivot levels with traditional SND concepts.
Furthermore, by implementing this logic when looking for pivots, a significant portion of potential noise is naturally filtered out.
🔶 DETAILS
In typical SND systems, the term "Base" is used for multiple meanings.
In this indicator, the base is a product of a pivot being formed. Once a Pivot is identified, the "Base" is marked as the first Rally or Drop of the second half of the pivot formation.
Once the pivot is identified, the high or low of the base candle is used to measure the pivot level.
🔶 SETTINGS
Length: Sets the number of Rally and Drop Candles that the script will require to identify pivots.
Ex. "3" = 3 Rally followed by 3 Drop
Historical Lookback: Hides historic levels based on a bar # Lookback from the current bar.
When set to 0, all Levels will display. (0 by default)

Fractal Breakout Trend Following System█ OVERVIEW
The Fractal Breakout Trend Following System is a custom technical analysis tool designed to pinpoint significant fractal pivot points and breakout levels. By analyzing price action through configurable pivot parameters, this indicator dynamically identifies key support and resistance zones. It not only marks crucial highs and lows on the chart but also signals potential trend reversals through real-time breakout detections, helping traders capture shifts in market momentum.
█ KEY FEATURES
Fractal Pivot Detection
Utilizes user-defined left and right pivot lengths to detect local highs (pivot highs) and lows (pivot lows). This fractal-based approach ensures that only meaningful price moves are considered, effectively filtering out minor market noise.
Dynamic Line Visualization
Upon confirmation of a pivot, the system draws a dynamic line representing resistance (from pivot highs) or support (from pivot lows). These lines extend across the chart until a breakout occurs, offering a continuous visual guide to key levels.
Trend Breakout Signals
Monitors for price crossovers relative to the drawn pivot lines. A crossover above a resistance line signals a bullish breakout, while a crossunder below a support line indicates a bearish move, thus updating the prevailing trend.
Pivot Labelling
Assigns labels such as "HH", "LH", "LL", or "HL" to detected pivots based on their relative values.
It uses the following designations:
HH (Higher High) : Indicates that the current pivot high is greater than the previous pivot high, suggesting continued upward momentum.
LH (Lower High) : Signals that the current pivot high is lower than the previous pivot high, which may hint at a potential reversal within an uptrend.
LL (Lower Low) : Shows that the current pivot low is lower than the previous pivot low, confirming sustained downward pressure.
HL (Higher Low) : Reveals that the current pivot low is higher than the previous pivot low, potentially indicating the beginning of an upward reversal in a downtrend.
These labels provide traders with immediate insight into the market structure and recent price behavior.
Customizable Visual Settings
Offers various customization options:
• Adjust pivot sensitivity via left/right pivot inputs.
• Toggle pivot labels on or off.
• Enable background color changes to reflect bullish or bearish trends.
• Choose preferred colors for bullish (e.g., green) and bearish (e.g., red) signals.
█ UNDERLYING METHODOLOGY & CALCULATIONS
Fractal Pivot Calculation
The script employs a sliding window technique using configurable left and right parameters to identify local highs and lows. Detected pivot values are sanitized to ensure consistency in subsequent calculations.
Dynamic Line Plotting
When a new pivot is detected, a corresponding line is drawn from the pivot point. This line extends until the price breaks the level, at which point it is reset. This method provides a continuous reference for support and resistance.
Trend Breakout Identification
By continuously monitoring price interactions with the pivot lines, the indicator identifies breakouts. A price crossover above a resistance line suggests a bullish breakout, while a crossunder below a support line indicates a bearish shift. The current trend is updated accordingly.
Pivot Label Assignment
The system compares the current pivot with the previous one to determine if the move represents a higher high, lower high, higher low, or lower low. This classification helps traders understand the underlying market momentum.
█ HOW TO USE THE INDICATOR
1 — Apply the Indicator
• Add the Fractal Breakout Trend Following System to your chart to begin visualizing dynamic pivot points and breakout signals.
2 — Adjust Settings for Your Market
• Pivot Detection – Configure the left and right pivot lengths for both highs and lows to suit your desired sensitivity:
- Use shorter lengths for more responsive signals in fast-moving markets.
- Use longer lengths to filter out minor fluctuations in volatile conditions.
• Visual Customization – Toggle the display of pivot labels and background color changes. Select your preferred colors for bullish and bearish trends.
3 — Interpret the Signals
• Support & Resistance Lines – Observe the dynamically drawn lines that represent key pivot levels.
• Pivot Labels – Look for labels like "HH", "LH", "LL", and "HL" to quickly assess market structure and trend behavior.
• Trend Signals – Watch for price crossovers and corresponding background color shifts to gauge bullish or bearish breakouts.
4 — Integrate with Your Trading Strategy
• Use the identified pivot points as potential support and resistance levels.
• Combine breakout signals with other technical indicators for comprehensive trade confirmation.
• Adjust the sensitivity settings to tailor the indicator to various instruments and market conditions.
█ CONCLUSION
The Fractal Breakout Trend Following System offers a robust framework for identifying critical fractal pivot points and potential breakout opportunities. With its dynamic line plotting, clear pivot labeling, and customizable visual settings, this indicator equips traders with actionable insights to enhance decision-making and optimize entry and exit strategies.

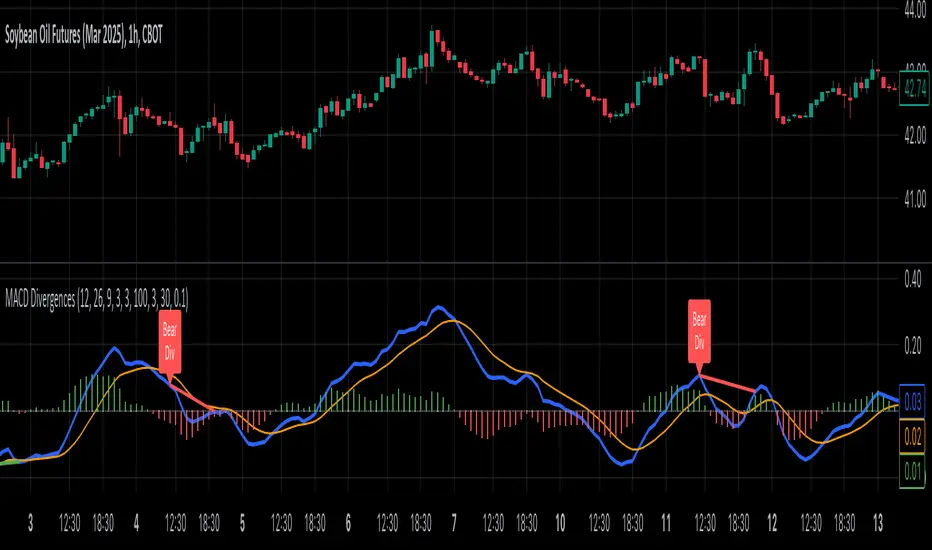
MACD Divergence all in oneMACD Divergence all in one
It can also be named as MACD dual divergence detector pro !
A sophisticated yet user-friendly tool designed to identify both bullish and bearish divergences using the MACD (Moving Average Convergence Divergence) indicator. This advanced script helps traders spot potential trend reversals by detecting hidden momentum shifts in the market, offering a comprehensive solution for divergence trading.
🎯 Key Features:
• Automatic detection of bullish and bearish divergences
• Clear visual signals with color-coded lines (Green for bullish, Red for bearish)
• Smart filtering system to eliminate false signals
• Customizable parameters to match your trading style
• Clean, uncluttered chart presentation
• Optimized performance for real-time analysis
• Easy-to-read labels showing divergence types
• Built-in signal spacing to avoid clustering
📊 How it works:
The indicator uses an advanced algorithm to analyze the relationship between price action and MACD momentum to identify:
Bullish Divergences:
- Price makes higher lows while MACD shows lower lows
- Signals potential trend reversal from bearish to bullish
- Marked with green lines and upward labels
Bearish Divergences:
- Price makes lower highs while MACD shows higher highs
- Signals potential trend reversal from bullish to bearish
- Marked with red lines and downward labels
⚙️ Customizable Settings:
1. MACD Parameters:
- Fast Length (default: 12)
- Slow Length (default: 26)
- Signal Length (default: 9)
2. Divergence Detection:
- Left/Right Pivot Bars
- Divergence Lookback Period
- Minimum/Maximum Divergence Length
- Divergence Strength Filter
3. Visual Settings:
- Clear color coding for easy identification
- Adjustable line thickness
- Customizable label size
💡 Best Practices:
- Most effective on higher timeframes (1H, 4H, Daily)
- Combine with support/resistance levels
- Use with trend lines and price action
- Consider volume confirmation
- Best results during trending markets
- Use appropriate stop-loss levels
🎓 Trading Tips:
1. Look for bullish divergences near support levels
2. Watch for bearish divergences near resistance zones
3. Confirm signals with other technical indicators
4. Consider market context and overall trend
5. Use proper position sizing and risk management
⚠️ Important Notes:
- Past performance doesn't guarantee future results
- Always use proper risk management
- Test settings on historical data first
- Different timeframes may require parameter adjustments
- Not all divergences lead to reversals
Created by: Anmol-max-star
Last Updated: 2025-02-25 16:15:08 UTC
📌 Regular updates and improvements planned!
Disclaimer:
This indicator is for informational purposes only. Always conduct your own analysis and use proper risk management techniques. Trading involves risk of loss, and past performance does not guarantee future results.
🤝 Support:
Feel free to leave comments for:
- Suggestions
- Improvements
- Feature requests
- Bug reports
- General feedback
Your feedback helps make this tool better for everyone!
Happy Trading and May the Trends Be With You! 📈
Volatility Price FlowCapitalize on market volatility with our new volatility price flow indicator. We have designed this indicator to process historical price movements and indicate when price may have reached exhaustion in the context of current volatility.
This is achieved by taking the price deviation from a user defined moving average, and applying a weighting to the deviations from the candle body and candle wick on both buy side and sell side, over a user defined period. The period of the base moving average, type of moving average and the period of the historical price deviations can all be modified. This creates a typical 'band' style indicator, though with a unique characteristic that the buy and sell side vary independently as well as the band expansion being based on weighted variables tied to the actual price changes, rather than just a standard deviation the moves uniformly.
Additionally, these bands can be merged with an anchored vwap - we do this so that the deviations of price from the moving average can include a more volume based approach to identifying potential pivots.
The end result is an indicator that reflects the current market price movements, identifies and capitalizes on impulsive or beginning moves to indicate potential tops / bottoms / reversals.
The signals are simple - anytime price closes within a band, having been outside the band, a signal is displayed. As a basic guide to setting the indicator up for the first time, we suggest reducing all of the multipliers to a value less than 1. Then gradually increase each one, until the signals reduce in quantity and improve in quality, starting with the price deviation multiplier, then the volatility multiplier and finally the expansion multiplier.
Last of all, alerts can be created based on the current chart timeframe and indicator settings, simply by adding an alert that uses the built in buy or sell signal.
Note: We cannot guarantee the accuracy of the signals provided, since the user creates the signals by modifying the settings, and as such we can take no responsibility for any trading losses incurred using the indicator and highly encourage all users to manage their risk and only risk what you can afford to lose.

Pivot Point+ Supertrend + EMA + Support/Resistance- LAXMANTAK98
Pivot Point Supertrend with EMA and Support/Resistance Indicator
This custom trading indicator combines the following key components to assist in market analysis and trade decision-making:
Pivot Points:
Pivot points are calculated based on a chosen price source (High, Low, Open, or Close). These levels are used to determine potential support and resistance zones.
Pivot Highs (Resistance) and Pivot Lows (Support) are plotted as labels on the chart for easy identification.
Supertrend Indicator:
The Supertrend is a trend-following indicator that helps to identify bullish or bearish trends.
It uses the Average True Range (ATR) to calculate dynamic support/resistance levels, with adjustable settings for ATR length and multiplier factor.
The trend direction is visually represented by green (bullish) and red (bearish) lines on the chart.
Exponential Moving Averages (EMA):
The indicator plots up to four EMAs with user-defined periods (e.g., 9, 21, 50, 200).
EMAs are commonly used to smooth out price data and identify trends over various timeframes.
Support and Resistance Levels:
Based on Pivot Points, support and resistance levels are plotted using crosses on the chart.
These levels indicate possible price reversal points, helping traders spot key zones for entry and exit.
Visual Alerts:
The indicator includes built-in alerts for trend changes and potential buy/sell signals based on the transition between uptrend and downtrend states.
This combined indicator allows traders to analyze trends, identify key levels for trading, and make more informed decisions by integrating Pivot Points, Supertrend, EMAs, and Support/Resistance in one cohesive system.

GOLDEN Trading System by @thejamiulThe Golden Trading System is a powerful trading indicator designed to help traders easily identify market conditions and potential breakout opportunities.
Source of this indicator :
This indicator is built on TradingView original pivot indicator but focuses exclusively on Camarilla pivots, utilising H3-H4 and L3-L4 as breakout zones.
Timeframe Selection:
Before start using it we should choose Pivot Resolution time-frame accordingly.
If you use 5min candle - use D
If you use 15min candle - use W
If you use 1H candle - use M
If you use 1D candle - use 12M
How It Works:
Sideways Market: If the price remains inside the H3-H4 as Green Band and L3-L4 as Red band, the market is considered range-bound.
Trending Market: If the price moves outside Green Band, it indicates a potential up-trend formation. If the price moves outside Red Band, it indicates a potential down-trend formation.
Additional Features:
Displays Daily, Weekly, Monthly, and Yearly Highs and Lows to help traders identify key support and resistance levels also helps spot potential trend reversal points based on historical price action. Suitable for both intraday and swing trading strategies.
This indicator is a trend-following and breakout confirmation tool, making it ideal for traders looking to improve their decision-making with clear, objective levels.
🔹 Note: This script is intended for educational purposes only and should not be considered financial advice. Always conduct your own research before making trading decisions.

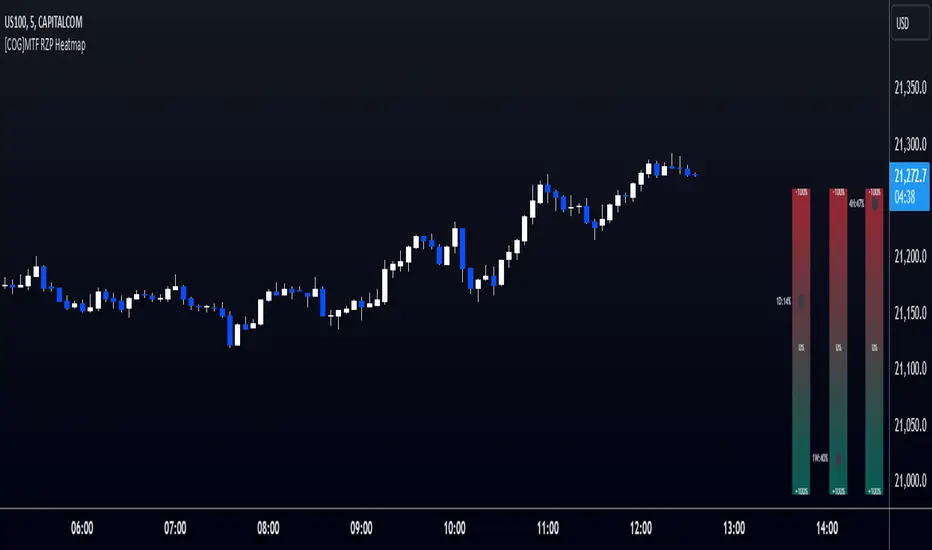
[COG]MTF RZP Heatmap MTF RZP Heatmap (Range Zone Pulse)
What It Does
This indicator creates three visual heatmaps that show how current price movement compares to the average range of different timeframes. It helps traders:
Identify when price moves are overextended
Compare momentum across different timeframes
Spot potential reversal points
Understand the relative strength of price movements
How It Works
Range Calculation:
For each selected timeframe, it calculates an average range based on the specified number of periods
The range is measured from high to low for each period
A moving average of these ranges creates a dynamic "normal" range for that timeframe
Position Calculation:
Measures how far price has moved from the period's opening price
Compares this movement to the average range
Converts the movement into a percentage (-100% to +100%)
Visual Display:
Shows three vertical heatmaps, one for each timeframe
Colors graduate from bearish (typically red) to bullish (typically green)
A dot indicator shows the current position within each range
Percentage labels show exact movement relative to average range
Trading Applications
Trend Trading:
Multiple timeframes aligned in the same color suggest strong trend
Use larger timeframes (Daily/Weekly) for trend direction
Use smaller timeframes (4H/1H) for entry timing
Mean Reversion:
Extreme readings (near +100% or -100%) suggest overextended moves
Look for divergences between timeframes
Use when shorter timeframes show extremes but larger timeframes don't
Volatility Trading:
Compare current moves to average ranges
Identify when markets are more volatile than usual
Adjust position sizes based on range expansion/contraction
Multi-Timeframe Analysis:
Compare price action across different time horizons
Identify conflicting signals between timeframes
Use for timeframe alignment in trading decisions
Best Practices for Usage
Timeframe Selection:
Set the first timeframe to your trading timeframe
Set the second timeframe to your trend timeframe
Set the third timeframe to your entry timeframe
Range Period Settings:
Default is 5 periods
Increase for more stable readings
Decrease for more responsive readings
Color Interpretation:
Darker colors indicate stronger moves
Look for alignment across timeframes
Watch for extremes in any timeframe
Trading Setups:
Wait for alignment in multiple timeframes
Use extreme readings for counter-trend trades
Combine with other indicators for confirmation
Dragon Harmonic Pattern [TradingFinder] Dragon Detector🔵 Introduction
The Dragon Harmonic Pattern is one of the technical analysis tools that assists traders in identifying Potential Reversal Zones (PRZ). Resembling an "M" or "W" shape, this pattern is recognized in financial markets as a method for predicting bullish and bearish trends. By leveraging precise Fibonacci ratios and measuring price movements, traders can use this pattern to forecast market trends with high accuracy.
The Dragon Harmonic Pattern is built on the XABCD structure, where each point plays a significant role in shaping and forecasting price movements. Point X marks the beginning of the trend, representing the initial price movement. Point A indicates the first retracement, usually falling within the 0.380 to 0.620 range of the XA wave.
Next, point B signals the second retracement, which lies within 0.200 to 0.400 of the AB wave. Point C, acting as the hump of the pattern, is generally located within 0.800 to 1.100 of the XA wave. Finally, point D represents the endpoint of the pattern and the Potential Reversal Zone (PRZ), where the primary price reversal occurs.
In bullish scenarios, the Dragon Pattern indicates a reversal from a downtrend to an uptrend, where prices move upward from point D. Conversely, in bearish scenarios, prices decline after reaching point D. Accurate identification of this pattern through Fibonacci ratio analysis and PRZ examination can significantly increase the success rate of trades, enabling traders to adjust their strategies based on key market levels such as 0.618 or 1.100.
Due to its high accuracy in identifying Potential Reversal Zones (PRZ) and its alignment with Fibonacci ratios, the Dragon Harmonic Pattern is considered one of the most popular tools in technical analysis. Traders can use this pattern to pinpoint entry and exit points with greater confidence while minimizing trading risks.
Bullish :
Bearish :
🔵 How to Use
The Dragon Harmonic Pattern indicator helps traders identify bullish and bearish patterns in the market, allowing them to capitalize on available trading opportunities. By analyzing Fibonacci ratios and the XABCD structure, the indicator highlights Potential Reversal Zones (PRZ).
🟣 Bullish Dragon Pattern
In the Bullish Dragon Pattern, the price transitions from a downtrend to an uptrend after reaching point D. At this stage, points X, A, B, C, and D must be carefully identified.
Fibonacci ratios for these points are as follows: Point A should fall within 0.380 to 0.620 of the XA wave, point B within 0.200 to 0.400 of the AB wave, and point C within 0.800 to 1.100 of the XA wave.
When the price reaches point D, traders should look for bullish signals such as reversal candlesticks or increased trading volume to enter a buy position. The take-profit level can be set near the previous price high or based on the 1.272 Fibonacci ratio of the XA wave, while the stop-loss should be placed slightly below point D.
🟣 Bearish Dragon Pattern
In the Bearish Dragon Pattern, the price shifts from an uptrend to a downtrend after reaching point D. In this pattern, points X, A, B, C, and D must also be identified. Fibonacci ratios for these points are as follows: Point A should fall within 0.380 to 0.620 of the XA wave, point B within 0.200 to 0.400 of the AB wave, and point C within 0.800 to 1.100 of the XA wave.
Upon reaching point D, bearish signals such as reversal candlesticks or decreasing trading volume indicate the opportunity to enter a sell position. The take-profit level can be set near the previous price low or based on the 1.272 Fibonacci ratio of the XA wave, while the stop-loss should be placed slightly above point D.
By combining the Dragon Harmonic Pattern indicator with precise Fibonacci ratio analysis, traders can identify key opportunities while minimizing risks and improving their decision-making in both bullish and bearish market conditions.
🔵 Setting
🟣 Logical Setting
ZigZag Pivot Period : You can adjust the period so that the harmonic patterns are adjusted according to the pivot period you want. This factor is the most important parameter in pattern recognition.
Show Valid Forma t: If this parameter is on "On" mode, only patterns will be displayed that they have exact format and no noise can be seen in them. If "Off" is, the patterns displayed that maybe are noisy and do not exactly correspond to the original pattern.
Show Formation Last Pivot Confirm : if Turned on, you can see this ability of patterns when their last pivot is formed. If this feature is off, it will see the patterns as soon as they are formed. The advantage of this option being clear is less formation of fielded patterns, and it is accompanied by the latest pattern seeing and a sharp reduction in reward to risk.
Period of Formation Last Pivot : Using this parameter you can determine that the last pivot is based on Pivot period.
🟣 Genaral Setting
Show : Enter "On" to display the template and "Off" to not display the template.
Color : Enter the desired color to draw the pattern in this parameter.
LineWidth : You can enter the number 1 or numbers higher than one to adjust the thickness of the drawing lines. This number must be an integer and increases with increasing thickness.
LabelSize : You can adjust the size of the labels by using the "size.auto", "size.tiny", "size.smal", "size.normal", "size.large" or "size.huge" entries.
🟣 Alert Setting
Alert : On / Off
Message Frequency : This string parameter defines the announcement frequency. Choices include: "All" (activates the alert every time the function is called), "Once Per Bar" (activates the alert only on the first call within the bar), and "Once Per Bar Close" (the alert is activated only by a call at the last script execution of the real-time bar upon closing). The default setting is "Once per Bar".
Show Alert Time by Time Zone : The date, hour, and minute you receive in alert messages can be based on any time zone you choose. For example, if you want New York time, you should enter "UTC-4". This input is set to the time zone "UTC" by default.
🔵 Conclusion
The Dragon Harmonic Pattern is an advanced and practical technical analysis tool that aids traders in accurately predicting bullish and bearish trends by identifying Potential Reversal Zones (PRZ) and utilizing Fibonacci ratios. Built on the XABCD structure, this pattern stands out for its flexibility and precision in identifying price movements, making it a valuable resource among technical analysts. One of its key advantages is its compatibility with other technical tools such as trendlines, support and resistance levels, and Fibonacci retracements.
By using the Dragon Harmonic Pattern indicator, traders can accurately determine entry and exit points for their trades. The indicator analyzes key Fibonacci ratios—0.380 to 0.620, 0.200 to 0.400, and 0.800 to 1.100—to identify critical levels such as price highs and lows, offering precise trading strategies. In bullish scenarios, traders can profit from rising prices, while in bearish scenarios, they can capitalize on price declines.
In conclusion, the Dragon Harmonic Pattern is a highly reliable tool for identifying trading opportunities with exceptional accuracy. However, for optimal results, it is recommended to combine this pattern with other analytical tools and thoroughly assess market conditions. By utilizing this indicator, traders can reduce their trading risks while achieving higher profitability and confidence in their trading strategies.

Fibonacci Trend [ChartPrime]Fibonacci Trend Indicator
This powerful indicator leverages supertrend analysis to detect market direction while overlaying dynamic Fibonacci levels to highlight potential support, resistance, and optimal trend entry zones. With its straightforward design, it is perfect for traders looking to simplify their workflow and enhance decision-making.
⯁ KEY FEATURES AND HOW TO USE
⯌ Supertrend Trend Identification :
The indicator uses a supertrend algorithm to identify market direction. It displays purple for downtrends and green for uptrends, ensuring quick and clear trend analysis.
⯌ Fibonacci Levels for Current Swings :
Automatically calculates Fibonacci retracement levels (0.236, 0.382, 0.618, 0.786) for the current swing leg.
- These levels act as key zones for potential support, resistance, and trend continuation.
- The high and low swing points are labeled with exact prices, ensuring clarity.
- If the swing range is insufficient (less than five times ATR), Fibonacci levels are not displayed, avoiding irrelevant data.
⯌ Extended Fibonacci Levels :
User-defined extensions project Fibonacci levels into the future, aiding traders in planning price targets or projecting key zones.
⯌ Optimal Trend Entry Zone :
A filled area between 0.618 and 0.786 levels visually highlights the optimal entry zone for trend continuation. This allows traders to refine their entry points during pullbacks.
⯌ Diagonal Trend Line :
A dashed diagonal line connects the swing high and low, visually confirming the range and trend strength of the current swing.
⯌ Visual Labels for Fibonacci Levels :
Each Fibonacci level is marked with a label displaying its value for quick reference.
⯁ HOW TRADERS CAN POTENTIALLY USE THIS TOOL
Fibonacci Retracements:
Use the Fibonacci retracement levels to find key support or resistance zones where the price may pull back before continuing its trend.
Example: Enter long trades when the price retraces to 0.618–0.786 levels in an uptrend.
Fibonacci Extensions:
Use Fibonacci extensions to project future price targets based on the current trend's swing leg. Levels like 127.2% and 161.8% are commonly used as profit-taking zones.
Reversal Identification:
Spot potential reversals by monitoring price reactions at key Fibonacci retracement levels (e.g., 0.236 or 0.382) or the swing high/low.
Optimal Trend Entries:
The filled zone between 0.618 and 0.786 is a statistically strong area for entering a position in the direction of the trend.
Example: Enter long positions during retracements to this range in an uptrend.
Risk Management:
Set stop-losses below key Fibonacci levels or the swing low/high, and take profits at extension levels, enhancing your trade management strategies.
⯁ CONCLUSION
The Fibonacci Trend Indicator is a straightforward yet effective tool for identifying trends and key Fibonacci levels. It simplifies analysis by integrating supertrend-based trend identification with Fibonacci retracements, extensions, and optimal entry zones. Whether you're a beginner or experienced trader, this indicator is an essential addition to your toolkit for trend trading, reversal spotting, and risk management.

Dynamic Support and Resistance Pivot Strategy The Dynamic Support and Resistance Pivot Strategy is a flexible and adaptive tool designed to identify short-term support and resistance levels using the concept of price pivots.
### Key Elements of the Strategy
1. Pivot points as support and resistance levels
Pivots are significant turning points on the price chart, often marking local highs and lows where the price has reversed direction. A pivot high occurs when the price forms a local peak, while a pivot low occurs when the price forms a local trough. When a new pivot high is formed, it creates a resistance level. Conversely, when a new pivot low is formed, it creates a support level.
The strategy continuously updates these levels as new pivots are detected, ensuring they remain relevant to the current market conditions. By identifying these price levels, the strategy dynamically adjusts to market conditions, allowing it to adapt to both trending and ranging markets, since it has a long target and can perform reversal operations.
2. Entry Criteria
- Buy (Long): A long position is triggered when the price is near the support level and then crosses it from below to above. This suggests that the price has found support and may start moving upwards.
- Sell (Short): A short position is triggered when the price is near the resistance level and then crosses it from above to below. This indicates that the price may be reversing and moving downward.
3. Support/Resistance distance (%)
- This parameter establishes a percentage range around the identified support and resistance level. For example, if the Support Resistance Distance is 0.4% (default), the closing price must be within a range of 0.4% above support or below the resistance to be considered "close" and trigger a trade.
4. Exit criteria
- Take profit = 27 %
- Stop loss = 10 %
- Reversal if a new entry point is identified in the opposite direction
5. No Repainting
- The Dynamic Support and Resistance Pivot Strategy is not subject to repainting.
6. Position Sizing by Equity and risk management
- This strategy has a default configuration to operate with 35% of the equity. The stop loss is set to 10% from the entry price. This way, the strategy is putting at risk about 10% of 35% of equity, that is, around 3.5% of equity for each trade. The percentage of equity and stop loss can be adjusted by the user according to their risk management.
7. Backtest results
- This strategy was subjected to backtest and operations in replay mode on **1000000MOGUSDT.P**, with the inclusion of transaction fees at 0.12% and slipagge of 5 ticks, and the past results have shown consistent profitability. Past results are no guarantee of future results. The strategy's backtest results may even be due to overfitting with past data.
8. Chart Visualization
- Support and resistance levels are displayed as green (support) and red (resistance) lines.
- Pivot prices are displayed as green (pivot low) and red (pivot high) labels.
In this image above, the Support/Resistance distance (%) parameter was set to 0.8.
9. Default Configuration
Chart Timeframe: 1h
Pivot Lengh: 2
Support/Resistance distance (%): 0.4*
Stop Loss: 10 %
Take Profit: 27 %
* This parameter can alternatively be set to 0.8.
10. Alternative Configuration
Chart Timeframe: 20 min
Pivot Lengh: 4
Support/Resistance distance (%): 0.1
Stop Loss: 10 %
Take Profit: 25 %
BYBIT:1000000MOGUSDT.P

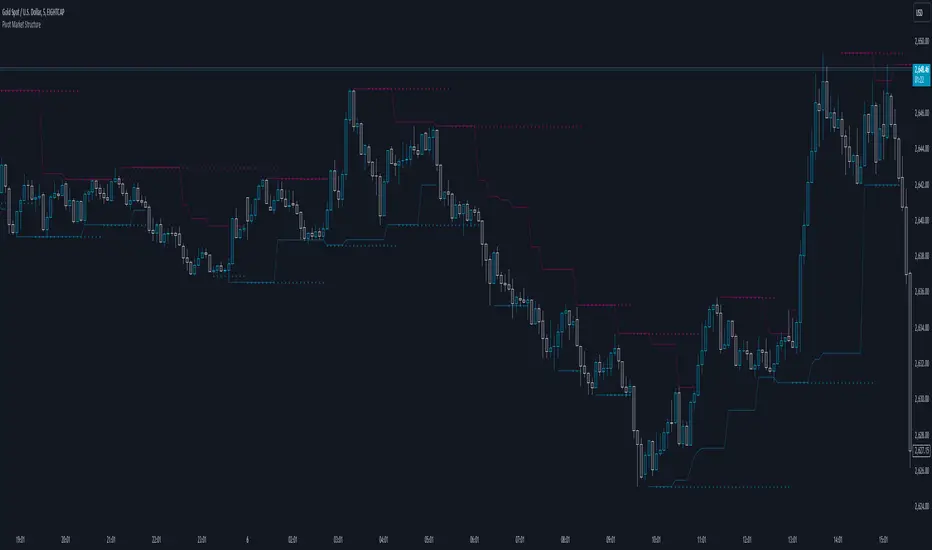
Pivot Market StructureDescription and Features
This script is designed to enhance technical analysis by identifying key market structure levels. It uses a price action trail (based on the last highest/lowest price) and pivot points to track market trends, offering insights into potential reversal zones or trend continuation signals.
How the Script Works
High/Low Trail Logic: The script includes a trail mechanism that compares the current price with the last highest and lowest price, determining whether the price has breached these levels. This helps pinpoint key price action events and potential trend shifts. Unlike pivot points the price action trail is more responsive changes within the market structure.
Step Size and Length for High/Low Trail:
- The Step Length parameter defines how many bars are used to compare the current price against the last highest/lowest price, providing a measure of price extremes.
- The Length parameter determines the number of bars considered for calculating the highest/lowest price since the last price action event (either price surpassing a previous high or dipping below a previous low).
Pivot Point Calculation: Pivot Point Highs are calculated by the number of bars with lower highs on either side of a Pivot Point High calculation. Similarly, Pivot Point Lows are calculated by the number of bars with higher lows on either side of a Pivot Point Low calculation. The script draws a line from/to every calculated pivot point to highlight market structure extremes. It can optionally extend these pivot lines to the left for added context, providing historical reference for decision-making.
Summary
By combining both pivot analysis and price action trailing techniques, the script provides a comprehensive view of a pivot point based market structure.
Nen Star Harmonic Pattern [TradingFinder] NenStar Reversal Auto🔵 Introduction
The Nen-Star Harmonic Pattern is an advanced reversal pattern in technical analysis, designed to identify market trend changes and predict key price reversal points. This pattern is defined by a combination of Fibonacci ratios and critical concepts such as Potential Reversal Zones (PRZ), market structure, and corrective waves.
The key points of this pattern include X, A, B, C, and D, and it appears in both bullish and bearish forms. In its bullish form, the pattern resembles the letter M, while in its bearish form, it takes the shape of W. The critical Fibonacci ratios for this pattern are 0.382 to 0.786 for the XA wave, 1.13 to 1.414 for the AB wave, and 1.272 to 2.618 for the BC wave.
The Nen-Star Harmonic Pattern is one of the most precise tools for identifying market reversals and executing reversal trades. Traders can use it to pinpoint optimal entry and exit points and benefit from high risk-to-reward ratios.
By emphasizing Fibonacci retracement levels, XABCD waves, the formation of bullish and bearish patterns, and precise trade entry points, this pattern has become a practical tool in advanced technical analysis.
Bullish Nen-Star Pattern :
Bearish Nen-Star Pattern :
🔵 How to Use
The Nen-Star Harmonic Pattern indicator allows traders to automatically identify the bullish and bearish structures of this pattern and locate optimal entry and exit points. By accurately analyzing Fibonacci ratios and determining points X, A, B, C, and D, the indicator highlights Potential Reversal Zones (PRZ) on the chart. Traders can rely on the generated signals to manage their trades with greater precision.
🟣 Bullish Nen-Star Pattern
The bullish Nen-Star pattern begins with a price increase from point X to point A, followed by a retracement to point B, which lies between 0.382 and 0.786 of the XA wave.
After this retracement, the price moves to point C, located between 1.13 and 1.414 of the AB wave. The final movement is a price decline to point D, which is between 1.272 and 2.618 of the BC wave and 1.13 to 1.272 of the XA wave.
Point D : Serves as the key Potential Reversal Zone (PRZ).
Entry : A buy trade is initiated at point D, signaling the end of the corrective movement and the beginning of a price increase.
Price Targets :
61.8% retracement of the CD wave
Point A
Point C
1.272 and 1.618 extensions of the CD wave if resistance at point C is broken
Stop Loss : Placed slightly below point D.
🟣 Bearish Nen-Star Pattern
The bearish Nen-Star pattern starts with a price decrease from point X to point A, followed by a retracement to point B, which lies between 0.382 and 0.786 of the XA wave.
After this retracement, the price moves to point C, located between 1.13 and 1.414 of the AB wave. The final movement is a price increase to point D, which is between 1.272 and 2.618 of the BC wave and 1.13 to 1.272 of the XA wave.
Point D : Serves as the key Potential Reversal Zone (PRZ).
Entry : A sell trade is initiated at point D, signaling the end of the corrective movement and the beginning of a price decline.
Price Targets :
61.8% retracement of the CD wave
Point A
Point C
1.272 and 1.618 extensions of the CD wave if support at point C is broken
Stop Loss : Placed slightly above point D.
🔵 Setting
🟣 Logical Setting
ZigZag Pivot Period : You can adjust the period so that the harmonic patterns are adjusted according to the pivot period you want. This factor is the most important parameter in pattern recognition.
Show Valid Forma t: If this parameter is on "On" mode, only patterns will be displayed that they have exact format and no noise can be seen in them. If "Off" is, the patterns displayed that maybe are noisy and do not exactly correspond to the original pattern.
Show Formation Last Pivot Confirm : if Turned on, you can see this ability of patterns when their last pivot is formed. If this feature is off, it will see the patterns as soon as they are formed. The advantage of this option being clear is less formation of fielded patterns, and it is accompanied by the latest pattern seeing and a sharp reduction in reward to risk.
Period of Formation Last Pivot : Using this parameter you can determine that the last pivot is based on Pivot period.
🟣 Genaral Setting
Show : Enter "On" to display the template and "Off" to not display the template.
Color : Enter the desired color to draw the pattern in this parameter.
LineWidth : You can enter the number 1 or numbers higher than one to adjust the thickness of the drawing lines. This number must be an integer and increases with increasing thickness.
LabelSize : You can adjust the size of the labels by using the "size.auto", "size.tiny", "size.smal", "size.normal", "size.large" or "size.huge" entries.
🟣 Alert Setting
Alert : On / Off
Message Frequency : This string parameter defines the announcement frequency. Choices include: "All" (activates the alert every time the function is called), "Once Per Bar" (activates the alert only on the first call within the bar), and "Once Per Bar Close" (the alert is activated only by a call at the last script execution of the real-time bar upon closing). The default setting is "Once per Bar".
Show Alert Time by Time Zone : The date, hour, and minute you receive in alert messages can be based on any time zone you choose. For example, if you want New York time, you should enter "UTC-4". This input is set to the time zone "UTC" by default.
🔵 Conclusion
The Nen-Star Harmonic Pattern is a highly effective analytical tool in global financial markets, playing a crucial role in identifying reversal points and market trend changes. By leveraging Fibonacci principles and price structure, this pattern enables precise analysis across various assets, including stocks, cryptocurrencies, forex, and commodities.
Traders operating in global markets can use this pattern to identify high risk-to-reward trading opportunities. Its clear entry and exit points, defined Potential Reversal Zones (PRZ), and accurate price targets make it an excellent tool for risk management and profitability enhancement.
In the global context, the Nen-Star pattern is widely used by professional analysts in both advanced and emerging markets due to its versatility in analyzing long-term and short-term charts. Beyond trend prediction, it enhances trading strategies and optimizes investment decisions.
Combining this pattern with complementary tools such as volume analysis, technical indicators, and macroeconomic conditions can provide traders with deeper market insights, helping them capitalize on global opportunities.
