Supply & Demand Histogram and Lines [BerlinCode42]
This is a Supply & Demand Histogram—also referred to as a Heatmap—that highlights key S&D levels on the chart. Unlike traditional approaches that use volume, this script identifies specific chart patterns and evaluates them to generate the Supply & Demand Histogram. It analyzes the Supply and the Demand separately.
The script is equipped with trade signals for external use (Indicator on Indicator) and is fully compatible with my strategy template script. This allows you to easily create backtests and combine it with other indicators to build a custom strategy.
- Intro
- Calculation of the Supply & Demand Histogram
- Usage and Settings Menu
- Declaration for Tradingview House Rules on Script Publishing
- Disclaimer
1. Calculation of the Supply & Demand Histogram
Initially, the total price range—spanning from the absolute minimum to the absolute maximum observed price—is discretized into 10,000 equally sized intervals. For each interval, the algorithm performs the following:
It detects chart patterns that typically emerge in zones of varying volatility, categorizing them accordingly. Each identified pattern is assigned a individual weight based on its structural parameters, such as amplitude or slope. Lets call them Structural Weights. These weighted occurrences are then aggregated per interval, resulting in a quantitative representation of supply and demand pressure across the price spectrum, visualized as a histogram.
This pattern-based methodology facilitates the quantitative estimation of supply and demand zones without reliance on volume metrics.
2. Usage and Settings Menu
Initially, the user can configure the granularity of the price segmentation used in the Supply & Demand Histogram. This is achieved by enabling the 'Show Price Range' option, as illustrated in Image 1. Activating this feature overlays a gray-shaded region on the chart, visually representing the defined price range.
Image 1
The vertical position of this range can be adjusted using the 'Price Range Offset' parameter, while the interval widths are modifiable via the 'Step Factor' setting. It is critical to ensure that the specified range encapsulates the entirety of historical and anticipated price movements; failure to do so may result in calculation errors if price action extends beyond the defined bounds. Nevertheless, the default Step Factor has been conservatively chosen to accommodate most price dynamics.
Due to performance considerations, the indicator does not render all 10,000 discrete intervals comprising the full histogram. Instead, it selectively displays a subset of 100 intervals centered around the most recent price."
Once the price range has been configured, disable the “Show Price Range” option again in order to display the Supply & Demand Histogram.
Subsequently, users can fine-tune the histogram computation via two key settings, shown in Image 2:
- Volume Count – This option allows selection between a pattern-based structural weighting method and a traditional volume-based approach for histogram construction. The structural method estimates significance through pattern characteristics rather than traded volume.
- Supply + Demand – This toggle determines whether Supply and Demand levels are calculated and displayed independently or merged into a unified histogram. If one subscribes to the principle that a breached Supply zone can transform into a Demand zone (and vice versa), enabling this option will reflect that assumption by aggregating both into a single composite structure.
Image 2
Once this setup is complete, the Supply & Demand Histogram along with its most significant price levels will be visualized on the chart. Users can further refine the display settings to tailor the visual output.
In the settings menu, refer to the section illustrated in Image 3. There, you can adjust the number of displayed price levels by increasing or decreasing the S&D Line Filter percentage. A lower percentage results in fewer, more prominent levels being shown, while a higher percentage includes more levels.
The S&D histogram itself can also be hidden if desired.
Image 3
This indicator supports external integration via Indicator on Indicator Functionality or alerts. Specifically, when a price level is either touched or broken, an alert can be triggered. To visually identify where such alerts would occur, enable Show Alert Labels, which marks the respective bars on the chart.
If you want to import the trade signals into a Backtest or Strategy Template script, simply use the two signal outputs: "Break Signals" and "Touch Signals".
- A value of zero indicates that no touching or breaking event is occurring.
- A positive value signifies that a supply level has been touched or broken.
- A negative value indicates a demand level interaction.
The absolute value of each signal corresponds to the price level of the respective Supply or Demand line.
The colors used to represent Supply and Demand levels can be customized to your preference.
Additionally, a Time and Session Filter has been added. This feature allows you to exclude specific time periods and dates from the analysis, enabling a better understanding of which trading times and market sessions are responsible for the formation of particular Supply & Demand levels.
To activate the filter, check the leftmost checkbox, then define the desired Date, Time, and Session parameters accordingly as shown in image 4.
Image 4
3. Declaration for Tradingview House Rules on Script Publishing
The unique feature of this Supply & Demand Histogram is its pattern-based calculation methodology. This approach enables the estimation of Supply and Demand levels even for assets that do not provide volume data. Additionally, it allows for separate computation of Supply and Demand. That means a broken Demand level does not necessarily convert into a Supply level, and vice versa.
This script is closed-source and invite-only to support and compensate for months long development work.
4. Disclaimer
Trading is risky, and traders do lose money, eventually all. This script is for informational and educational purposes only. All content should be considered hypothetical, selected post-factum and is not to be construed as financial advice. Decisions to buy, sell, hold, or trade in securities, commodities, and other investments involve risk and are best made based on the advice of qualified financial professionals. Past performance does not guarantee future results. Using this script on your own risk. This script may have bugs and I declare don't be responsible for any losses.
Now it’s your turn!
Image U1
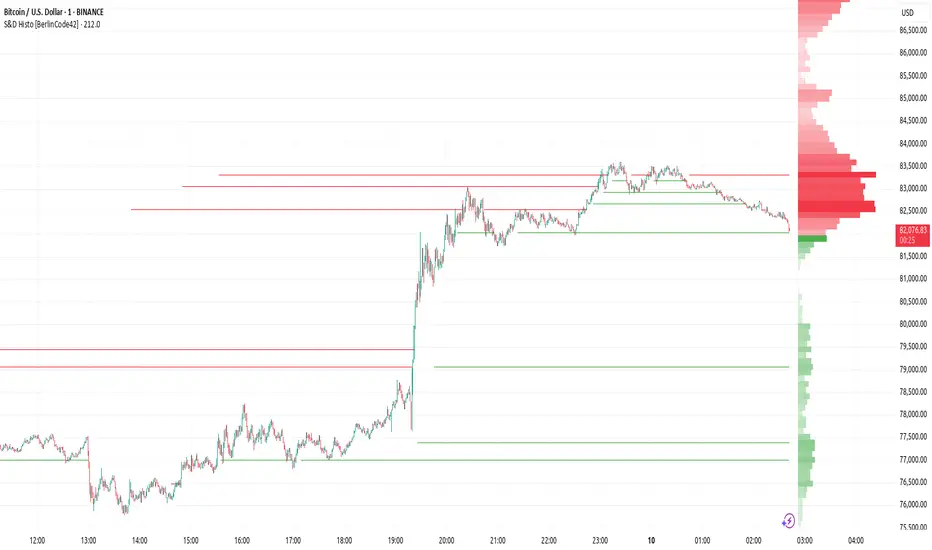
In this Slippery Zones the price can run fast up or down because it happens in the past so or because the price rise into new and unknown levels.
In the Image U2 you can see such event. On the left side this indicator shows many and wide Slippery Zones and an empty Supply Histogram and later the break-out shown at the right side.
Skrip jemputan sahaja
Hanya pengguna disahkan oleh penulis boleh mengakses skrip ini. Anda perlu memohon dan mendapatkan kebenaran untuk menggunakannya. Keizinan selalunya diberikan selepas pembayaran. Untuk lebih butiran, ikuti arahan penulis di bawah atau hubungi BerlinCode42 secara terus.
Ambil maklum bahawa skrip peribadi dan jemputan sahaja ini masih belum disemak oleh moderator skrip dan pematuhannya dengan Peraturan Dalaman adalah belum ditentukan. TradingView TIDAK menyarankan pembayaran atau penggunaan skrip kecuali anda mempercayai sepenuhnya penulis dan memahami bagaimana ia berfungsi. Anda juga boleh menjumpai alternatif sumber terbuka dan percuma yang lain di dalam skrip komuniti kami.
Arahan penulis
Penafian
Skrip jemputan sahaja
Hanya pengguna disahkan oleh penulis boleh mengakses skrip ini. Anda perlu memohon dan mendapatkan kebenaran untuk menggunakannya. Keizinan selalunya diberikan selepas pembayaran. Untuk lebih butiran, ikuti arahan penulis di bawah atau hubungi BerlinCode42 secara terus.
Ambil maklum bahawa skrip peribadi dan jemputan sahaja ini masih belum disemak oleh moderator skrip dan pematuhannya dengan Peraturan Dalaman adalah belum ditentukan. TradingView TIDAK menyarankan pembayaran atau penggunaan skrip kecuali anda mempercayai sepenuhnya penulis dan memahami bagaimana ia berfungsi. Anda juga boleh menjumpai alternatif sumber terbuka dan percuma yang lain di dalam skrip komuniti kami.