OPEN-SOURCE SCRIPT
Days Since –1% Down Close
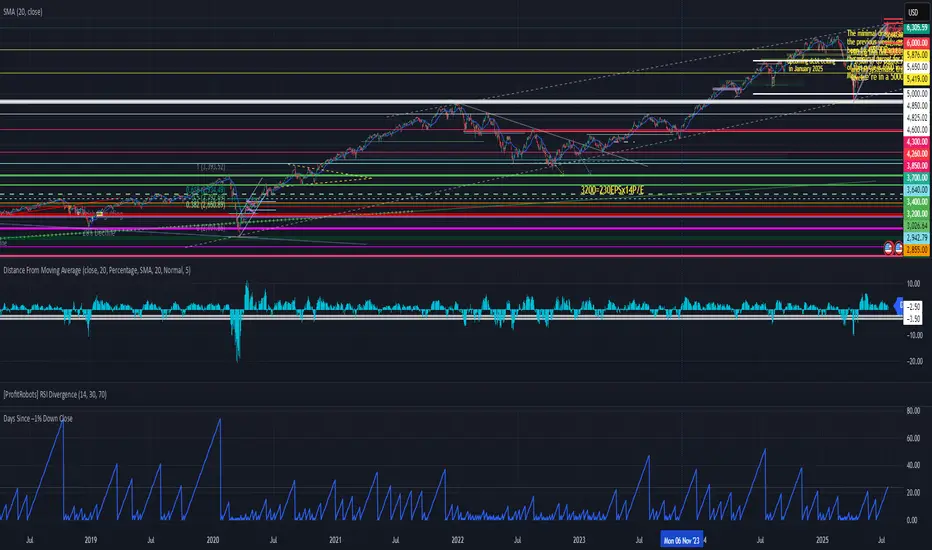
“Days since last down 1% close” indicator
This is a useful tool for investors and analysts to gauge market momentum, volatility, and potential risk:
1. Measuring Market Stability and Momentum
2. Identifying Potential Overbought Conditions
3. Volatility Assessment
4. Contextualizing Seasonal or External Factors
5. Risk Management and Timing
Actionable Insight: Combine this with real-time data (e.g., VIX levels or economic releases like tomorrow’s potential market-moving news)
In summary, the "Days since last down 1% close" indicator helps investors monitor market health, spot overextension, and manage risk by providing a historical benchmark for volatility.
Skrip sumber terbuka
Dalam semangat sebenar TradingView, pencipta skrip ini telah menjadikannya sumber terbuka supaya pedagang dapat menilai dan mengesahkan kefungsiannya. Terima kasih kepada penulis! Walaupun anda boleh menggunakannya secara percuma, ingat bahawa menerbitkan semula kod ini adalah tertakluk kepada Peraturan Dalaman kami.
Penafian
Maklumat dan penerbitan adalah tidak dimaksudkan untuk menjadi, dan tidak membentuk, nasihat untuk kewangan, pelaburan, perdagangan dan jenis-jenis lain atau cadangan yang dibekalkan atau disahkan oleh TradingView. Baca dengan lebih lanjut di Terma Penggunaan.