OPEN-SOURCE SCRIPT
Telah dikemas kini Fourier Analysis and Filtering [tbiktag]
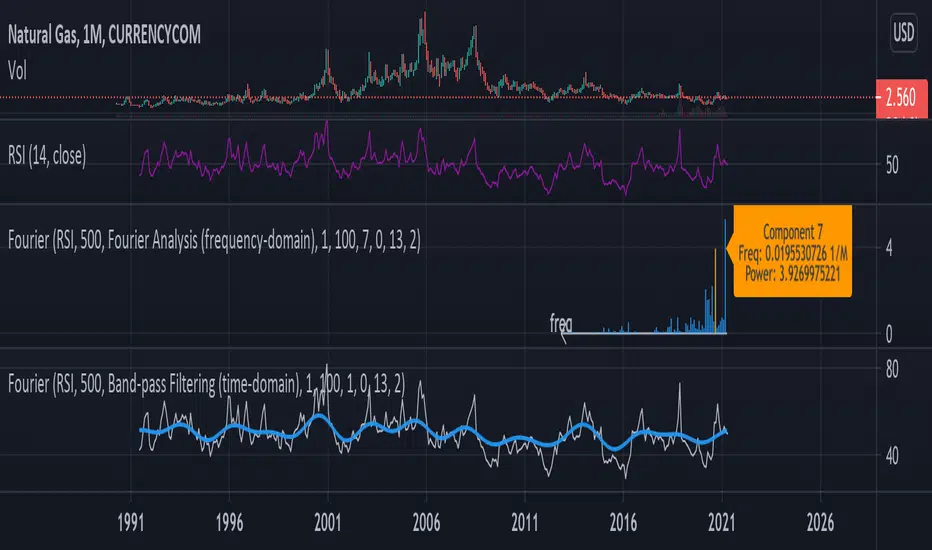
This tool uses Fourier transform to decompose the input time series into its periodic constituents and seasonalities, in other words, its frequency components. It also can reconstruct the time-domain data while using only the frequency components within a user-defined range (band-pass filtering). Thereby, this tool can reveal the cyclical characteristics of the studied market.
USAGE
The source and the size of the input data can be chosen by the “Dataset Source” and “Dataset Size” options. Price, volume, or some technical indicator (e.g., RSI, MACD, etc.) can serve as a source of the input data.
“Action” defines the type of the plot that will be displayed. Two options are available:
- Fourier Analysis
If selected, the frequency spectrum of the squares of the Fourier coefficient magnitudes is displayed. The zero-frequency component is on the right. Since the magnitudes of half of the coefficients are repeated, the graph displays only half of the frequency components.
The squared magnitude of a given frequency component is a measure of its power, that is, its contribution to the total variance of the dataset. Thus, by analyzing the frequency-domain spectrum, one can identify the most prominent seasonalities and then visualize them by using the "Band-pass Filtering" option (see below). Note that the zero component stores information about the amount of data, so it is naturally higher when the data is not centered at zero.
By activating the "Info about Frequency Component" option, the user can display information about the power and frequency of the selected Fourier component.
-Band-pass Filter
This option reconstructs and plots the dataset in the time domain, blocking frequency components outside of the cutoff frequencies (defined by the input parameters “Upper Cutoff” and “Lower Cutoff” input parameters in the “Band-pass Filter Properties” section).
FURTHER READING
In general, Fourier analysis has a long history of attempted applications for analyzing price data and estimating market cycles. For example, see the paper by John Ehlers
mesasoftware.com/papers/FourierTransformForTraders.pdf
and also some tools available here on TradingView, such as:
“Function: Discrete Fourier Transform” by RicardoSantos
“Fourier series Model Of The Market” by @e2e4mfck
“Ehlers Discrete Fourier Transform” by cheatcountry
Thus, I tried to make this tool versatile and user-friendly so you all can experiment with your own analysis.
Enjoy and don't hesitate to leave your feedback in the comments below!
Nota Keluaran
Added the option to adjust the scale of the filtered data to the original input time series.+ cosmetic changes in the code
Skrip sumber terbuka
Dalam semangat TradingView sebenar, pencipta skrip ini telah menjadikannya sumber terbuka, jadi pedagang boleh menilai dan mengesahkan kefungsiannya. Terima kasih kepada penulis! Walaupuan anda boleh menggunakan secara percuma, ingat bahawa penerbitan semula kod ini tertakluk kepada Peraturan Dalaman.
Penafian
Maklumat dan penerbitan adalah tidak bertujuan, dan tidak membentuk, nasihat atau cadangan kewangan, pelaburan, dagangan atau jenis lain yang diberikan atau disahkan oleh TradingView. Baca lebih dalam Terma Penggunaan.