PROTECTED SOURCE SCRIPT
CVD Candlestick - Milana Trades
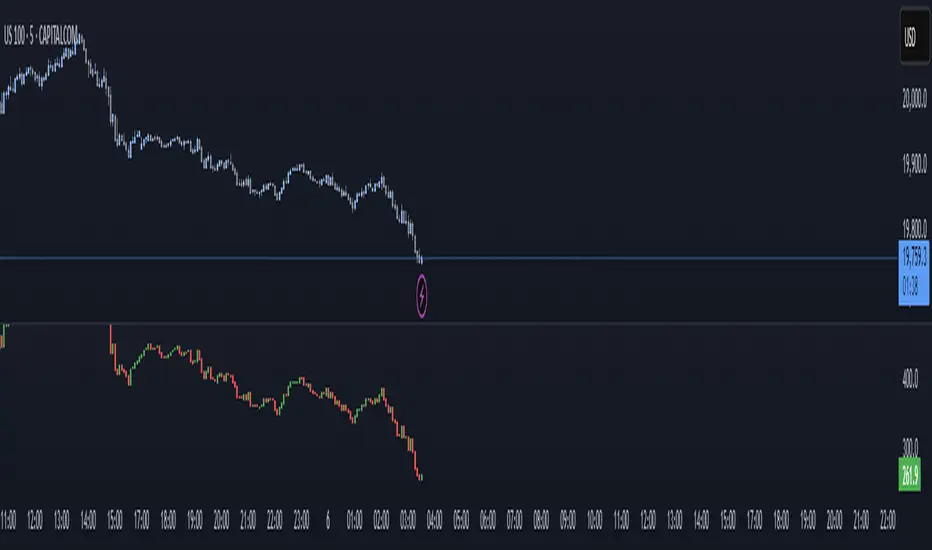
The CVD Candlestick indicator visualizes Cumulative Volume Delta (CVD) in the form of candlesticks, providing a deeper insight into intrabar buying and selling pressure.
Instead of plotting CVD as a simple line, this indicator displays it as a candle chart, allowing traders to analyze the momentum of volume delta just like price action.
How it Works
Delta is calculated as the difference between the bar’s close and open: delta = close - open.

Divergence + ICT-Based Confirmation
This indicator can be used effectively to detect CVD-price divergences, which may signal early signs of weakness in the current trend. When integrated with ICT (Inner Circle Trader) concepts, it becomes a powerful tool for precision-based trading setups.
CVD Divergence Logic:
A bearish divergence occurs when price makes a higher high while CVD makes a lower high — suggesting weakening buyer aggression.
A bullish divergence occurs when price makes a lower low while CVD makes a higher low — signaling potential seller exhaustion.
ICT Confirmation Methods:
After identifying divergence on CVD, traders may look for confirmation using ICT techniques, such as:
Instead of plotting CVD as a simple line, this indicator displays it as a candle chart, allowing traders to analyze the momentum of volume delta just like price action.
How it Works
Delta is calculated as the difference between the bar’s close and open: delta = close - open.
Divergence + ICT-Based Confirmation
This indicator can be used effectively to detect CVD-price divergences, which may signal early signs of weakness in the current trend. When integrated with ICT (Inner Circle Trader) concepts, it becomes a powerful tool for precision-based trading setups.
CVD Divergence Logic:
A bearish divergence occurs when price makes a higher high while CVD makes a lower high — suggesting weakening buyer aggression.
A bullish divergence occurs when price makes a lower low while CVD makes a higher low — signaling potential seller exhaustion.
ICT Confirmation Methods:
After identifying divergence on CVD, traders may look for confirmation using ICT techniques, such as:
1) Liquidity sweeps (e.g. price takes out a prior high/low into a divergence zone)
2) Breaker blocks or order blocks aligning with the divergence area
3) Market structure shifts following divergence
4) Optimal Trade Entry (OTE) levels confluencing with CVD-based signals
Example Setup:
Identify divergence between price and CVD.
Wait for liquidity sweep or market structure break in the same zone.
Confirm entry with lower time frame precision, if needed.
Data Candle
CVD is computed as the cumulative sum of delta over time.
For each bar, a synthetic candlestick is generated based on:
CVD Open = previous CVD value
CVD Close = current CVD value
High/Low = relative range based on Open/Close
Candlestick color indicates whether buyers (green) or sellers (red) dominated the bar.
Note: This implementation uses price-based delta for simplicity and works universally across assets. For bid/ask-based delta, a feed with order book data is required, which is not accessible in Pine Script.
Use Cases
Identify divergences between price and volume delta
Confirm or question breakouts and trend strength
Use in combination with VWAP, volume profile, or liquidity zones
Analyze intrabar sentiment in a candlestick format
Features
CVD represented as full candlesticks
Clear color distinction for delta direction
Works on all symbols and timeframes
Lightweight and responsive
Skrip dilindungi
Skrip ini diterbitkan sebagai sumber tertutup. Akan tetapi, anda boleh menggunakannya secara bebas dan tanpa apa-apa had – ketahui lebih di sini.
Penafian
Maklumat dan penerbitan adalah tidak bertujuan, dan tidak membentuk, nasihat atau cadangan kewangan, pelaburan, dagangan atau jenis lain yang diberikan atau disahkan oleh TradingView. Baca lebih dalam Terma Penggunaan.