Ekambit Volume Strength Index (EVSI)
We at Ekambit Technologies use it daily, together with ESI indicator, with consistent success in the Indian and US markets.
This indicator is effective for intraday timeframes as we have backtested as well as deployed on the live market.
Usage:
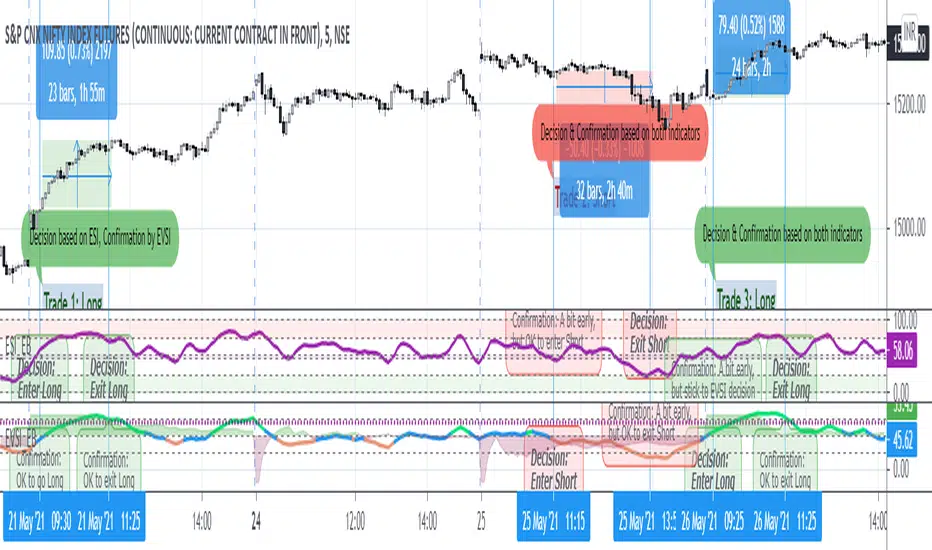
1) Green & above mid-zone & rising: uptrend
2) Green & falling from high-zone: uptrend reversal
3) Red & below mid-zone & falling: downtrend
4) Red & rising from low-zone: downtrend reversal
5) Blue: transition middle-zone (wait to enter, or exit on opportunity)
For greater conviction before entering a trade, enable the "Show Trend" option, which compares recent volume strength with long-term historical volume strength.
For the above example,
* The purple dotted line (around 65) shows the long term historical volume trend strength.
* The green shaded area indicates that current volume trend strength is around 5% stronger than historical, which should provide greater conviction to the direction shown by EVSI indicator. This delta (recent minus historical) is shown with a base of 50, to align with the middle line of EVSI and provide you with an easy visually perceptible output.
Learning:
Just like price has memory, volume has memory. Volume indicates the collective outcome of all market participants. A larger number of participants makes it easier to predict the volume trend in a probabilistic manner.
Hence Index Futures like
For Futures which trade almost 24x7, it's better to choose the high volume time periods i.e. when local Equity market is Open, rather than the overnight illiquid time periods.
- Improved EVSI calculation
- Showcase latest example from 28-May-2021
- Show EVSI usage together with ESI indicator, for a stronger conviction for entering and exiting trades
Skrip jemputan sahaja
Hanya pengguna yang diberikan kebenaran oleh penulis mempunyai akses kepada skrip ini dan ini selalunya memerlukan pembayaran. Anda boleh menambahkan skrip kepada kegemaran anda tetapi anda hanya boleh menggunakannya selepas meminta kebenaran dan mendapatkannya daripada penulis — ketarhui lebih lanjut di sini. Untuk lebih butiran, ikuti arahan penulis di bawah atau hubungi ekambit secara terus.
TradingView tidak menyarankan pembayaran untuk atau menggunakan skrip kecuali anda benar-benar mempercayai penulisnya dan memahami bagaimana ia berfungsi. Anda juga boleh mendapatkan alternatif sumber terbuka lain yang percuma dalam skrip komuniti kami.
Arahan penulis
Amaran: sila baca panduan kami untuk skrip jemputan sahaja sebelum memohon akses.
Penafian
Skrip jemputan sahaja
Hanya pengguna yang diberikan kebenaran oleh penulis mempunyai akses kepada skrip ini dan ini selalunya memerlukan pembayaran. Anda boleh menambahkan skrip kepada kegemaran anda tetapi anda hanya boleh menggunakannya selepas meminta kebenaran dan mendapatkannya daripada penulis — ketarhui lebih lanjut di sini. Untuk lebih butiran, ikuti arahan penulis di bawah atau hubungi ekambit secara terus.
TradingView tidak menyarankan pembayaran untuk atau menggunakan skrip kecuali anda benar-benar mempercayai penulisnya dan memahami bagaimana ia berfungsi. Anda juga boleh mendapatkan alternatif sumber terbuka lain yang percuma dalam skrip komuniti kami.
Arahan penulis
Amaran: sila baca panduan kami untuk skrip jemputan sahaja sebelum memohon akses.