OPEN-SOURCE SCRIPT
UCS_Cycle
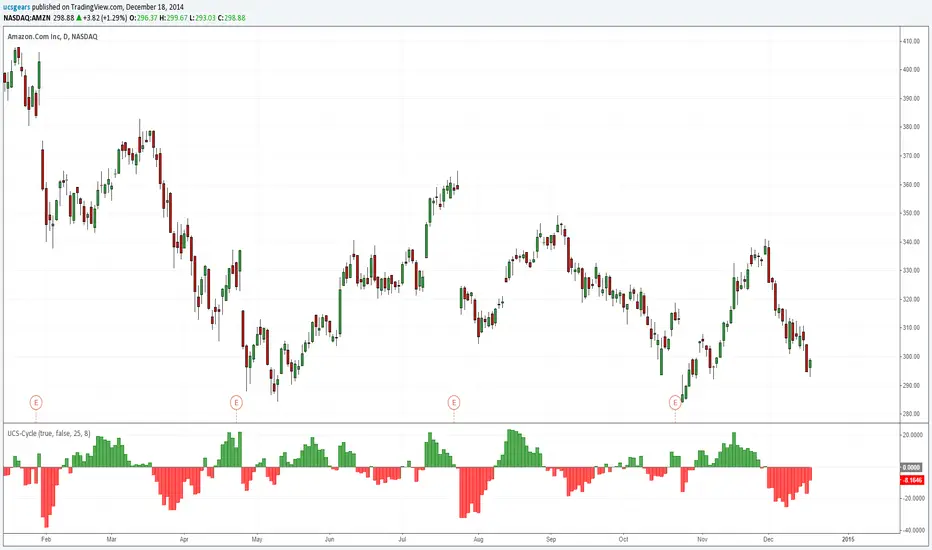
This indicator was designed to remove trend from price and make it easier to identify cycles.
Although this indicator has similarities to MACD. It is better used to identify the cycle of High and Lows based on the Statistical Data (Default is set to 25).
**** DO NOT USE THIS AS A MOMENTUM INDICATOR ****
Although this indicator has similarities to MACD. It is better used to identify the cycle of High and Lows based on the Statistical Data (Default is set to 25).
**** DO NOT USE THIS AS A MOMENTUM INDICATOR ****
Skrip sumber terbuka
Dalam semangat sebenar TradingView, pencipta skrip ini telah menjadikannya sumber terbuka supaya pedagang dapat menilai dan mengesahkan kefungsiannya. Terima kasih kepada penulis! Walaupun anda boleh menggunakannya secara percuma, ingat bahawa menerbitkan semula kod ini adalah tertakluk kepada Peraturan Dalaman kami.
Uday C Santhakumar
Penafian
Maklumat dan penerbitan adalah tidak dimaksudkan untuk menjadi, dan tidak membentuk, nasihat untuk kewangan, pelaburan, perdagangan dan jenis-jenis lain atau cadangan yang dibekalkan atau disahkan oleh TradingView. Baca dengan lebih lanjut di Terma Penggunaan.