OHO ATM Machine
We have used different type of candle stick patterns, open, close, high, low, Moving Averages, volumes and Average True Ranges in creation of this indicator.
Usage:
It can be used for scalping and intra-day trading. It works best on Nifty 5 Minutes , 15 Minutes, 1 Hour, Daily, Weekly and Monthly Time Frames.
It provides easy to visualize multiple information:
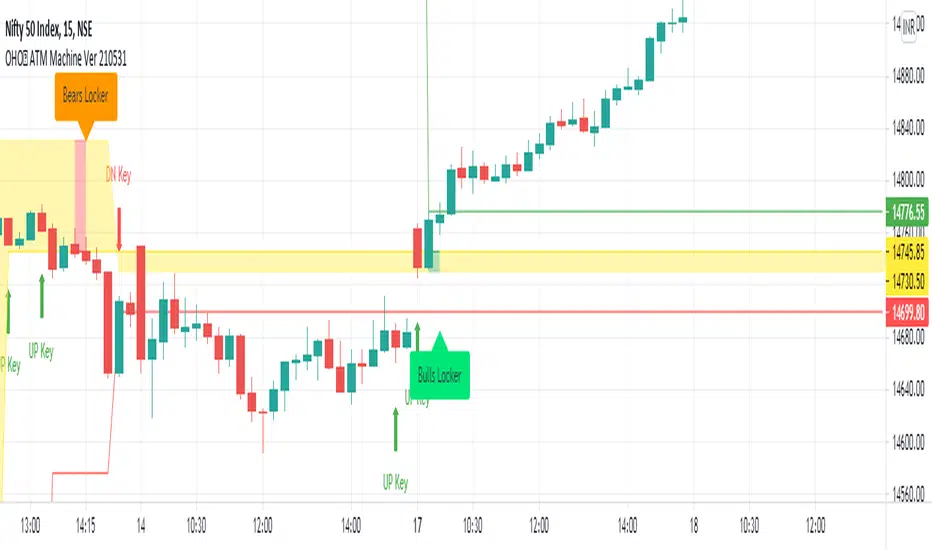
1) It gives the correct Entry on Time. Yellow ATM Area, Means No Trade.
2) Fake Signals are shown when There is Sell Signal and Below is ATM Area.
3) Fake Signals are shown when There is Buy Signal and Above is ATM Area.
4) It gives proper Target at the time of Entry.
5) Stop Loss is Hit when The Candle Closes below ATM Area in Buying and vice versa.
6) No Trade is Recommended, when ATM Area is Yellow.
How to read OHO ATM Machine Indicator?
Buy - When ATM Area is Turned Green in Color First Time after Last Red.
Sell - When ATM Area is Turned Red in Color First Time after Last Green.
Stop Loss - When The Candle Closes below ATM Area in Buy Trade and When The Candle Closes above ATM Area in Sell Trade.
Target - Thin Green Line for Buy Trade and Thin Red for Sell Trade.
Trailing SL - We can Trail the Trade, till the Stop Loss is HIT.
Recommendations:
This can be used for Nifty, Bank Nifty, Stocks, Commodities, Bitcoin, Currency and any other tradable instrument.
What time frame should I use?
5 Minutes and 15 Minutes are best time-frames for Intra-day Trades.
15 Minutes and Hourly are best time-frames for Swing Trades.
Hourly and Daily are best time-frames for Short Term Trades.
But you can check different time-frames in Strategy Testing section or as per your requirements.
Disclaimer:
Past performance is not the guarantee of future performance.
For any type of queries kindly send us personal message.
2.) Easy to Find Sell Entry when there is Bears Locker.
3.) Trailing Profit/Stop Loss Line will guide you to maximize the profits and minimize the losses.
4.) Dn Key Means Downside Entry for Risky Players along with given targets.
5.) Up Key Means Upside Entry for Risky Players along with given targets.
6.) Expected Range will give you clear information about the trading range.
7.) Expected Big Moves means trend is expected to be continued.
Skrip jemputan sahaja
Hanya pengguna yang diberikan kebenaran oleh penulis mempunyai akses kepada skrip ini dan ini selalunya memerlukan pembayaran. Anda boleh menambahkan skrip kepada kegemaran anda tetapi anda hanya boleh menggunakannya selepas meminta kebenaran dan mendapatkannya daripada penulis — ketarhui lebih lanjut di sini. Untuk lebih butiran, ikuti arahan penulis di bawah atau hubungi AIATMMACHINE secara terus.
TradingView tidak menyarankan pembayaran untuk atau menggunakan skrip kecuali anda benar-benar mempercayai penulisnya dan memahami bagaimana ia berfungsi. Anda juga boleh mendapatkan alternatif sumber terbuka lain yang percuma dalam skrip komuniti kami.
Arahan penulis
Amaran: sila baca panduan kami untuk skrip jemputan sahaja sebelum memohon akses.
Penafian
Skrip jemputan sahaja
Hanya pengguna yang diberikan kebenaran oleh penulis mempunyai akses kepada skrip ini dan ini selalunya memerlukan pembayaran. Anda boleh menambahkan skrip kepada kegemaran anda tetapi anda hanya boleh menggunakannya selepas meminta kebenaran dan mendapatkannya daripada penulis — ketarhui lebih lanjut di sini. Untuk lebih butiran, ikuti arahan penulis di bawah atau hubungi AIATMMACHINE secara terus.
TradingView tidak menyarankan pembayaran untuk atau menggunakan skrip kecuali anda benar-benar mempercayai penulisnya dan memahami bagaimana ia berfungsi. Anda juga boleh mendapatkan alternatif sumber terbuka lain yang percuma dalam skrip komuniti kami.
Arahan penulis
Amaran: sila baca panduan kami untuk skrip jemputan sahaja sebelum memohon akses.