OPEN-SOURCE SCRIPT
Candle Channel
█ OVERVIEW
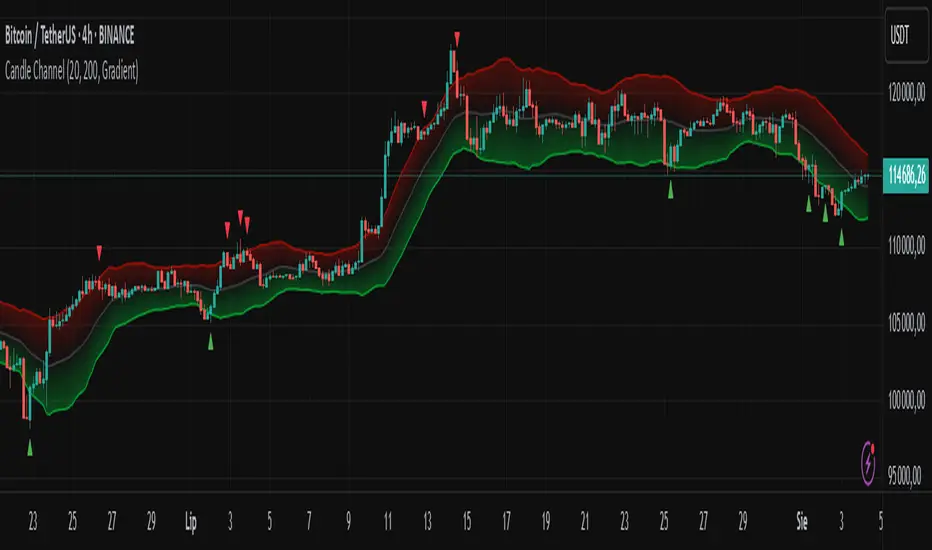
The "Candle Channel" indicator is a versatile technical analysis tool that plots a price channel based on the Simple Moving Average (SMA) of candlestick midpoints. The channel bands, calculated based on candlestick volatility, form dynamic support and resistance levels that adapt to price movements. The script generates signals for reversals from the bands and SMA breakouts, making it useful for both short-term and long-term traders. By adjusting the SMA length, the channel can vary in nature—from a wide channel encapsulating price movement to narrower support/resistance or trend-following bands. The channel width can be further customized using a scaling parameter, allowing adaptation to different trading styles and markets.
█ MECHANISM
Band Calculation
The indicator is based on the following calculations:
Candlestick Midpoint: Calculated as the arithmetic average of the candle’s high and low prices: (high + low) / 2.
Simple Moving Average (SMA): The average of candlestick midpoints over a specified length (default: 20 candles), forming the channel’s centerline.
Average Candle Height: Calculated as the average difference between the high and low prices (high - low) over the same SMA length, serving as a measure of market volatility.
Band Scaling: The user specifies a percentage of the average candle height (default: 200%), which is multiplied by the average height to create an offset. The upper band is SMA + offset, and the lower band is SMA - offset.Example: For an average candle height of 10 points and 200% scaling, the offset is 20 points, meaning the bands are ±20 points from the SMA.
Channel Characteristics: The SMA length determines the channel’s dynamics. Shorter SMA values (10–30) create a wide channel that contains price movement, ideal for scalping or short-term trading. Longer SMA values (above 30, e.g., 50–100) transform the channel into narrower support/resistance or trend-following bands, suitable for longer-term analysis. Band scaling further adjusts the channel width to match market volatility.
Signals
Reversal from Bands: Signals are generated when the price closes outside the band (above the upper or below the lower) and then returns to the channel, indicating a potential trend reversal.
SMA Breakout: Signals are generated when the price crosses the SMA upward (bullish signal) or downward (bearish signal), suggesting potential trend changes.
Visualization
Centerline: The SMA of candlestick midpoints, displayed as a thin line.
Channel Bands: Upper and lower channel boundaries, with customizable colors.
Fill: Options include a gradient (smooth color transition between bands) or solid color. The fill can also be disabled for greater clarity.
█ FEATURES AND SETTINGS
SMA Length: Determines the moving average period (default: 20). Values of 10–30 are suitable for a wide channel containing price movement, ideal for short-term timeframes. Longer values (e.g., 50–100) create narrower support/resistance or trend-following bands, better suited for higher timeframes.
Band Scaling: Percentage of the average candle height (default: 200%). Adjusts the channel width to match market volatility—smaller values (e.g., 50–100%) for narrower bands, larger values (e.g., 200–300%) for wider channels.
Fill Type: Gradient, solid, or no fill, allowing customization to user preferences.
Colors: Options to change the colors of bands, fill, and signals for better readability.
Signals: Options to enable/disable reversal signals from bands and SMA breakout signals.
█ HOW TO USE
Add the script to your chart in TradingView by clicking "Add to Chart" in the Pine Editor.
Adjust input parameters in the script settings:
SMA Length: Set to 10–30 for a wide channel containing price movement, suitable for scalping or short-term trading. Set above 30 (e.g., 50–100) for narrower support/resistance or trend-following bands.
Band Scaling: Adjust the channel width to market volatility. Smaller values (50–100%) for tighter support/resistance bands, larger values (200–300%) for wider channels containing price movement.
Fill Type and Colors: Choose a gradient for aesthetics or a solid fill for clarity.
Analyze signals:
Reversal Signals: Triangles above (bearish) or below (bullish) candles indicate potential reversal points.
SMA Breakout Signals: Circles above (bearish) or below (bullish) candles indicate trend changes.
Test the indicator on different instruments and timeframes to find optimal settings for your trading style.
█ LIMITATIONS
The indicator may generate false signals in highly volatile or consolidating markets.
On low-liquidity charts (e.g., exotic currency pairs), the bands may be less reliable.
Effectiveness depends on properly matching parameters to the market and timeframe.
Skrip sumber terbuka
Dalam semangat TradingView sebenar, pencipta skrip ini telah menjadikannya sumber terbuka, jadi pedagang boleh menilai dan mengesahkan kefungsiannya. Terima kasih kepada penulis! Walaupuan anda boleh menggunakan secara percuma, ingat bahawa penerbitan semula kod ini tertakluk kepada Peraturan Dalaman.
Penafian
Maklumat dan penerbitan adalah tidak bertujuan, dan tidak membentuk, nasihat atau cadangan kewangan, pelaburan, dagangan atau jenis lain yang diberikan atau disahkan oleh TradingView. Baca lebih dalam Terma Penggunaan.