OPEN-SOURCE SCRIPT
Telah dikemas kini ORB + Premarket High/Low
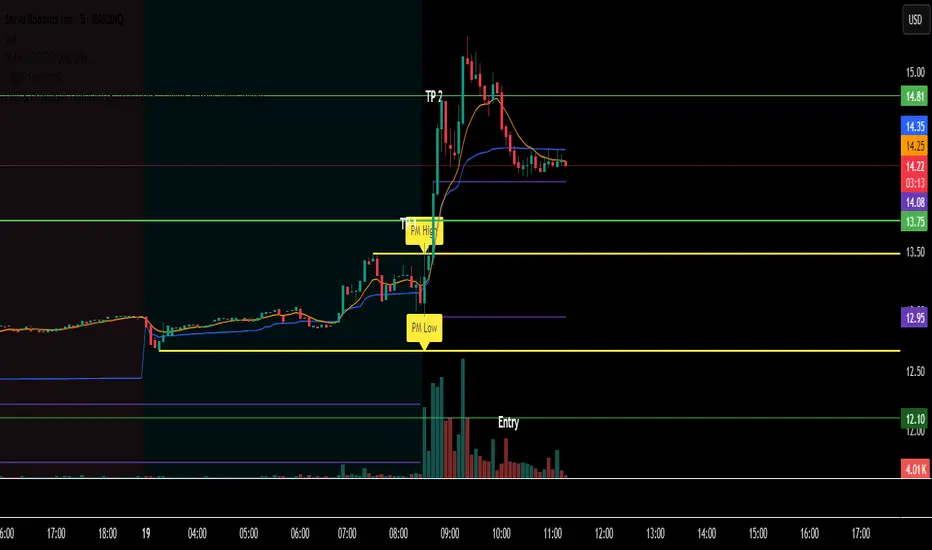
indicator that show opening range break plus premarket highs and lows
Nota Keluaran
Indicator DescriptionThis indicator is a key part of a trading strategy focused on breakouts and breakdowns. It automatically marks two important price levels:
Premarket High and Low: The indicator identifies the highest and lowest prices reached during the premarket session (4:00 AM to 9:30 AM EST). It then draws these levels as horizontal lines that extend through the rest of the trading day.
Morning Open: It also highlights the first 15 minutes of the regular market open, which is what you use as your "Opening Range Breakout" (ORB) zone. Make sure to change this in settings as 9:30 to 9:45 EST
By clearly plotting these premarket and opening range levels on your chart, this tool helps you visualize key support and resistance zones, which is crucial for trading breakout and breakdown strategies.
Skrip sumber terbuka
Dalam semangat TradingView sebenar, pencipta skrip ini telah menjadikannya sumber terbuka, jadi pedagang boleh menilai dan mengesahkan kefungsiannya. Terima kasih kepada penulis! Walaupuan anda boleh menggunakan secara percuma, ingat bahawa penerbitan semula kod ini tertakluk kepada Peraturan Dalaman.
Penafian
Maklumat dan penerbitan adalah tidak bertujuan, dan tidak membentuk, nasihat atau cadangan kewangan, pelaburan, dagangan atau jenis lain yang diberikan atau disahkan oleh TradingView. Baca lebih dalam Terma Penggunaan.