PROTECTED SOURCE SCRIPT
Midgar's DikFat Dynamic Support and Resistance
Midgar Heiken-Ashi Commission Indicator
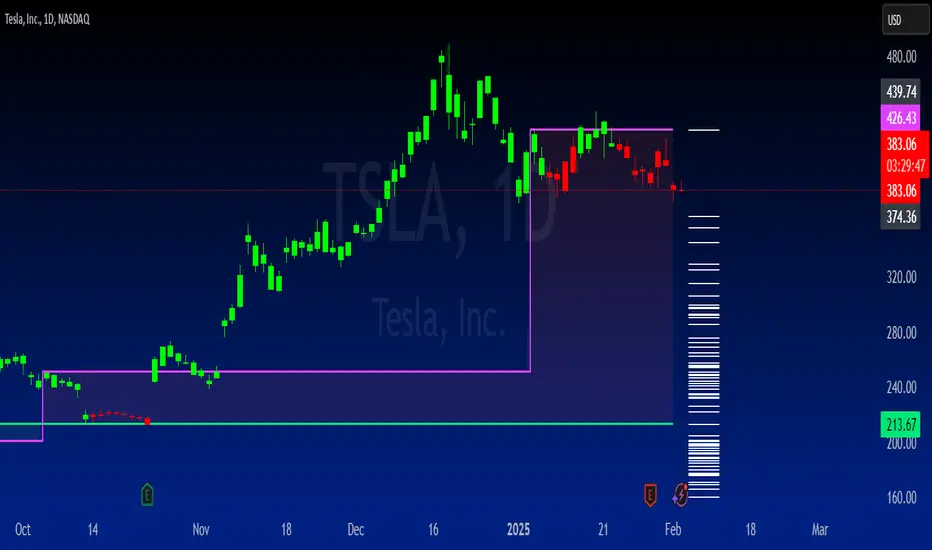
This indicator is a leading indicator designed to identify key price levels and potential support/resistance zones using Heiken-Ashi calculations. It provides visual aids such as dynamic support/resistance lines, price labels, and percentage distance tags to help traders interpret market structure more effectively.
How It Works:
1. Heiken-Ashi Calculation
- The indicator constructs Heiken-Ashi values based on standard formulas.
- The open price is smoothed using prior Heiken-Ashi values to maintain continuity.
2. Dynamic Support & Resistance (S/R) Detection
- Identifies "sandwich" Heiken-Ashi candles (specific bullish or bearish patterns).
- Plots dynamic support and resistance levels based on these key candles.
- Two sets of support/resistance lines are available:
- Primary Dynamic S/R (based on strong HA reversals).
- Companion Indicator Dynamic S/R (a secondary validation layer).
3. Customizable Visualization
- Infinite or right-extended support/resistance lines.
- Price labels at key levels (optional).
- Custom background color highlighting for detected S/R areas.
- Adjustable transparency settings for improved chart clarity.
4. Percentage Distance Calculation
- Calculates the percentage difference between detected support and resistance levels.
- Optionally displays distance tags for quick reference.
Important Notes:
- This is a leading indicator. It aims to highlight potential future support and resistance areas rather than reacting to past movements.
- Recommended for use on a candlestick chart. Using it on a other chart types may produce unintended results.
- No single indicator should be relied upon for trading decisions. Always use multiple forms of analysis and risk management strategies.
- Trading results are never guaranteed. Past performance does not predict future results, and all trading involves risk.
This indicator provides a structured view of market behavior using Heiken-Ashi principles, helping traders visualize potential support and resistance zones more effectively.
Skrip dilindungi
Skrip ini diterbitkan sebagai sumber tertutup. Akan tetapi, anda boleh menggunakannya secara bebas dan tanpa apa-apa had – ketahui lebih di sini.
All opinions while deemed valid by its operators and shared on this board are not financial advice and are primarily for Entertainment Purposes.
Penafian
Maklumat dan penerbitan adalah tidak bertujuan, dan tidak membentuk, nasihat atau cadangan kewangan, pelaburan, dagangan atau jenis lain yang diberikan atau disahkan oleh TradingView. Baca lebih dalam Terma Penggunaan.