OPEN-SOURCE SCRIPT
Recent Swing High/Low Lines With Stats Table
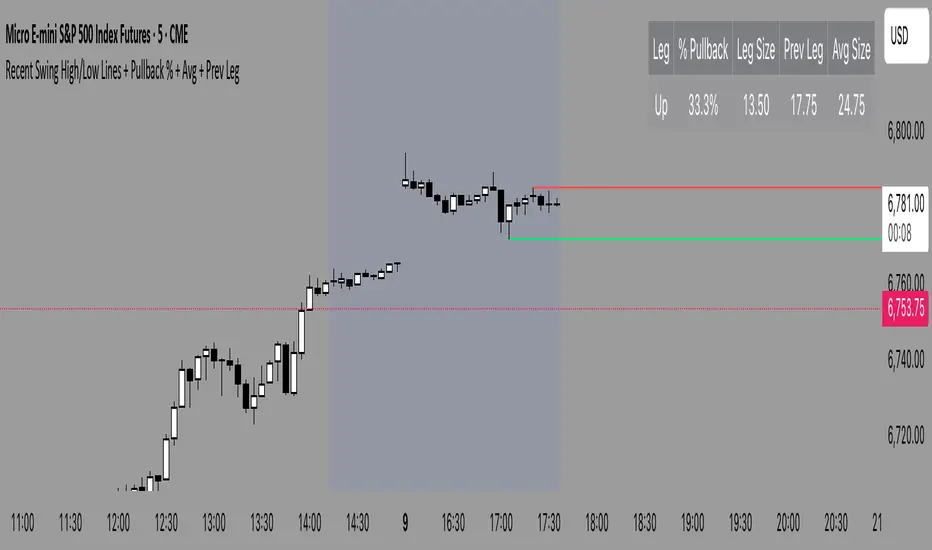
Swing-Based Volatility
This indicator measures volatility using the distance between recent swing highs and swing lows rather than fixed averages like ATR. Each swing captures a meaningful shift in market control, making this a structure-aware view of volatility.
The tool calculates and plots the average swing range over time, highlighting when the market is expanding (wide swings, high volatility) or contracting (tight swings, low volatility). These phases can help traders identify breakout potential, adjust stop-loss or profit targets, and align position sizing with current market conditions.
Skrip sumber terbuka
Dalam semangat sebenar TradingView, pencipta skrip ini telah menjadikannya sumber terbuka supaya pedagang dapat menilai dan mengesahkan kefungsiannya. Terima kasih kepada penulis! Walaupun anda boleh menggunakannya secara percuma, ingat bahawa menerbitkan semula kod ini adalah tertakluk kepada Peraturan Dalaman kami.
Penafian
Maklumat dan penerbitan adalah tidak dimaksudkan untuk menjadi, dan tidak membentuk, nasihat untuk kewangan, pelaburan, perdagangan dan jenis-jenis lain atau cadangan yang dibekalkan atau disahkan oleh TradingView. Baca dengan lebih lanjut di Terma Penggunaan.