OPEN-SOURCE SCRIPT
Telah dikemas kini X HL Q
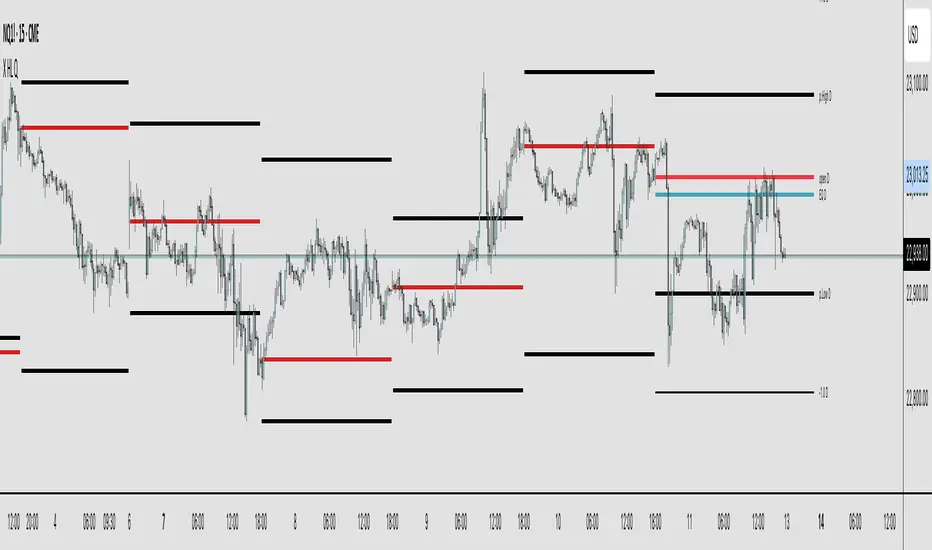
A market structure tool designed to frame price action within a defined context of prior session dynamics. It accomplishes this by anchoring a set of reference levels to the high, low, and open prices of a user-specified higher timeframe (e.g., 4H, 1D, etc.) and projecting those levels onto the current chart for ongoing analysis.
At its core, the indicator establishes a reference range—derived from the previous completed instance of the selected timeframe—and overlays this on the current timeframe. This range serves as a foundational structure for price interpretation in the current session.
Building upon this framework, the script constructs a set of symmetrical quadrants (or deviation zones) both inside and outside of the prior range. These include:
The midpoint (EQ) of the prior range
Levels at ±0.25x, ±0.75x, ±1.0x, ±1.5x, and ±2.0x the range height
These levels act as contextual zones that traders can use to interpret price behavior—whether it's consolidating within the prior range, approaching fair value (EQ), or expanding into directional continuation or reversal zones beyond the range.
The script operates in both real-time and historical contexts. On live bars, it dynamically updates the key levels to provide an evolving view of current price positioning. Simultaneously, it supports the display of historical levels for past sessions, enabling robust backtesting and comparative analysis of price behavior relative to previous quadrant structures.
Ultimately, this tool serves as a positional map, helping traders assess where price is trading relative to significant levels from the prior session, offering insights into potential support/resistance, overextension, or mean reversion scenarios.
Key Technical Features
Multi-Timeframe Support:
request.security() is used to pull data from a user-defined higher timeframe regardless of the current chart interval.
Visual Flexibility:
Toggle between "line" and "channel" mode.
Line color, width, and visibility are all user-controlled.
Anchoring Options:
Deviation levels can be calculated from either the previous period's open or its EQ (midpoint), giving flexibility depending on analytical preference.
Efficient Labeling:
Labels are only rendered on the last bar and are automatically cleared and redrawn to prevent duplication.
Label style, size, text color, and background color are all user-configurable.
Trading Application
This indicator is especially suited for:
1. Mean Reversion Strategies
When price moves beyond +1.0 or +1.5 deviations from the EQ or open, it may signal overextension and a potential snap back to the midpoint or range.
2. Breakout Confirmation
Sustained price action beyond ±1.0 levels may indicate trend strength or continuation beyond historical balance zones.
3. Contextual Range Awareness
EQ and Open provide structure from which traders can judge whether price is in a state of balance or imbalance.
Labels offer at-a-glance interpretation of key levels across any chosen timeframe.
4. Fractal and Multi-Session Analysis
Analysts can layer daily, weekly, and monthly versions of this indicator to observe confluence or divergence of higher timeframe structure.
Nota Keluaran
added control over line width Nota Keluaran
clean up and fixed image Skrip sumber terbuka
Dalam semangat TradingView sebenar, pencipta skrip ini telah menjadikannya sumber terbuka, jadi pedagang boleh menilai dan mengesahkan kefungsiannya. Terima kasih kepada penulis! Walaupuan anda boleh menggunakan secara percuma, ingat bahawa penerbitan semula kod ini tertakluk kepada Peraturan Dalaman.
Penafian
Maklumat dan penerbitan adalah tidak bertujuan, dan tidak membentuk, nasihat atau cadangan kewangan, pelaburan, dagangan atau jenis lain yang diberikan atau disahkan oleh TradingView. Baca lebih dalam Terma Penggunaan.
Skrip sumber terbuka
Dalam semangat TradingView sebenar, pencipta skrip ini telah menjadikannya sumber terbuka, jadi pedagang boleh menilai dan mengesahkan kefungsiannya. Terima kasih kepada penulis! Walaupuan anda boleh menggunakan secara percuma, ingat bahawa penerbitan semula kod ini tertakluk kepada Peraturan Dalaman.
Penafian
Maklumat dan penerbitan adalah tidak bertujuan, dan tidak membentuk, nasihat atau cadangan kewangan, pelaburan, dagangan atau jenis lain yang diberikan atau disahkan oleh TradingView. Baca lebih dalam Terma Penggunaan.