OPEN-SOURCE SCRIPT
Dynamic Candle Range Point Indicator
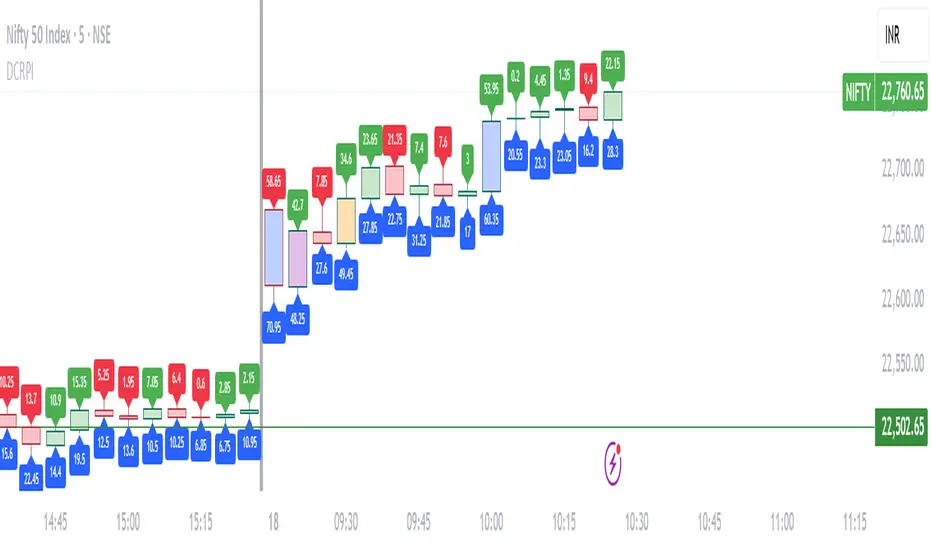
The "Dynamic Candle Range Point Indicator" (DCRPI) does two important jobs at once. For each candle on your chart, it shows you exactly how many points the price moved in two different ways:
1. At the top of each candle, you'll see how many points the price moved from open to close (the body range)
2. At the bottom, you'll see the total movement from the highest to lowest point (the full range)
The really smart part is how it colors the borders of candles based on how much the price moved. This gives you a quick visual way to spot significant price movements:
- Small movements keep the standard green/red colors
- Medium movements (25-30 points) show as yellow
- Larger movements get more unique colors (orange, purple, blue, etc.)
This makes it easy to instantly identify which candles had the most significant price movement without having to read all the numbers. You can quickly spot the most volatile candles across your chart by their distinctive border colors.
The indicator is lightweight and should run smoothly on most charts without causing performance issues.
Skrip sumber terbuka
Dalam semangat TradingView sebenar, pencipta skrip ini telah menjadikannya sumber terbuka, jadi pedagang boleh menilai dan mengesahkan kefungsiannya. Terima kasih kepada penulis! Walaupuan anda boleh menggunakan secara percuma, ingat bahawa penerbitan semula kod ini tertakluk kepada Peraturan Dalaman.
Penafian
Maklumat dan penerbitan adalah tidak bertujuan, dan tidak membentuk, nasihat atau cadangan kewangan, pelaburan, dagangan atau jenis lain yang diberikan atau disahkan oleh TradingView. Baca lebih dalam Terma Penggunaan.