OPEN-SOURCE SCRIPT
McClellan Oscillator [LazyBear]
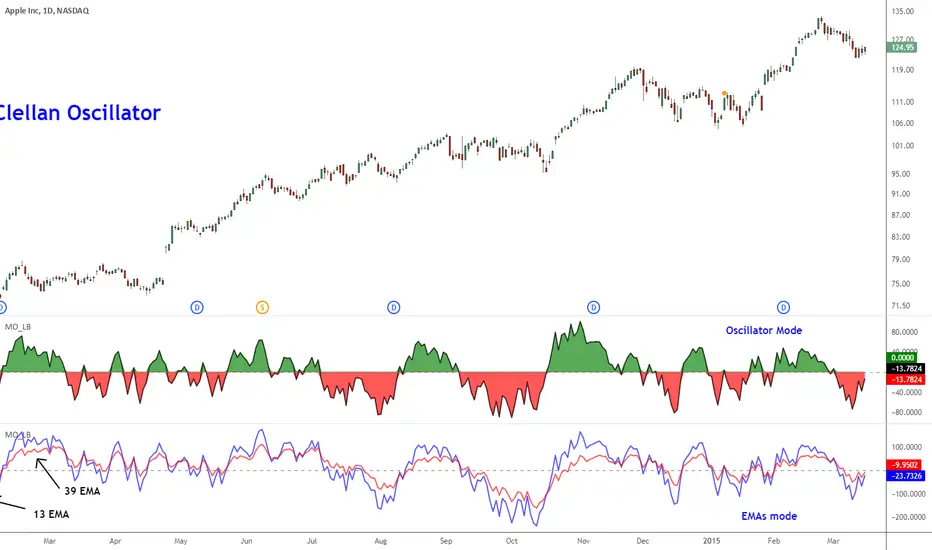
Developed by Sherman and Marian McClellan, the McClellan Oscillator is a breadth indicator derived from Net Advances, the number of advancing issues less the number of declining issues. Subtracting the 39-day exponential moving average of Net Advances from the 19-day exponential moving average of Net Advances forms the oscillator.
As the formula reveals, the McClellan Oscillator is a momentum indicator that works similar to MACD.
McClellan Oscillator signals can be generated with breadth thrusts, centerline crossovers, overall levels and divergences.
I have added the following options:
- Can choose Advancing/Declining issues of any market. Default is NYSE.
- Can show the EMAs and/or oscillator.
- Ratio Adjusted Calculation mode (as explained in the stockcharts link below) or default mode.
- Can use custom timeframe. Default is chart timeframe.
More info:
stockcharts.com/school/doku.php?id=chart_school:technical_indicators:mcclellan_oscillator
Complete list of my indicators:
docs.google.com/document/d/15AGCufJZ8CIUvwFJ9W-IKns88gkWOKBCvByMEvm5MLo/edit?usp=sharing
Thanks mpinky for pointing out the StockCharts version of this oscillator.
Skrip sumber terbuka
Dalam semangat sebenar TradingView, pencipta skrip ini telah menjadikannya sumber terbuka supaya pedagang dapat menilai dan mengesahkan kefungsiannya. Terima kasih kepada penulis! Walaupun anda boleh menggunakannya secara percuma, ingat bahawa menerbitkan semula kod ini adalah tertakluk kepada Peraturan Dalaman kami.
List of my free indicators: bit.ly/1LQaPK8
List of my indicators at Appstore: blog.tradingview.com/?p=970
List of my indicators at Appstore: blog.tradingview.com/?p=970
Penafian
Maklumat dan penerbitan adalah tidak dimaksudkan untuk menjadi, dan tidak membentuk, nasihat untuk kewangan, pelaburan, perdagangan dan jenis-jenis lain atau cadangan yang dibekalkan atau disahkan oleh TradingView. Baca dengan lebih lanjut di Terma Penggunaan.