OPEN-SOURCE SCRIPT
Telah dikemas kini Tickers Info Extension
With the indicator you can easily evaluate or compare any ticker with the one you choose in the options.
You can choose any of the tickers I provide in the mod options to your liking :
You can also select or create your own ticker if you select the Custom in Mode option.
If the Compare mode is enabled, then the current ticker you are viewing is divided by the ticker selected in the indicator (in the Mode option).
Thus, you create a new pair and can evaluate the strength of this or that asset.
For example, if you have the ticker BTCUSDT open. And the ticker XAU is selected in the Mode option in the indicator. And the Compare mode is also enabled. Then you will get a new BTCUSDT/XAU pair. That means that now you can see the bitcoin/gold ratio. (Same as EUR/USD etc.)
If the Compare option is switched off then you will see the usual ticker you choose in the Mode option. You can also see if there is a correlation between the selected pairs.
Option 'AVG STABLE.D' = Calculated as: USDT.D + USDC.D + DAI.D
- This is the average domination of the most important Stable Coins
Option 'AVG STOCK Price' = Calculated as: (DJI + SPX + NDQ) / 3
- This is the average price of the most important Indexes.
You can choose any of the tickers I provide in the mod options to your liking :
- XAU
- DXY
- BTC
- ETH
- SPX
- NASDAQ
- AVG Stable Dominance
- AVG Stock Price
- Custom
You can also select or create your own ticker if you select the Custom in Mode option.
If the Compare mode is enabled, then the current ticker you are viewing is divided by the ticker selected in the indicator (in the Mode option).
Thus, you create a new pair and can evaluate the strength of this or that asset.
For example, if you have the ticker BTCUSDT open. And the ticker XAU is selected in the Mode option in the indicator. And the Compare mode is also enabled. Then you will get a new BTCUSDT/XAU pair. That means that now you can see the bitcoin/gold ratio. (Same as EUR/USD etc.)
If the Compare option is switched off then you will see the usual ticker you choose in the Mode option. You can also see if there is a correlation between the selected pairs.
Option 'AVG STABLE.D' = Calculated as: USDT.D + USDC.D + DAI.D
- This is the average domination of the most important Stable Coins
Option 'AVG STOCK Price' = Calculated as: (DJI + SPX + NDQ) / 3
- This is the average price of the most important Indexes.
Nota Keluaran
// Globale UpdateNota Keluaran
Added a built-in option to capitalize altcoins excluding ETH (TOTAL3).Added an option to choose "Logarithmic" and "Linear" chart type. The default is Logarithmic.
Added an option to view not only the candlestick chart but also a simple linetype depending on the source [OPEN, HIGH, LOW, CLOSE].
Ppolished up the code a little.
Nota Keluaran
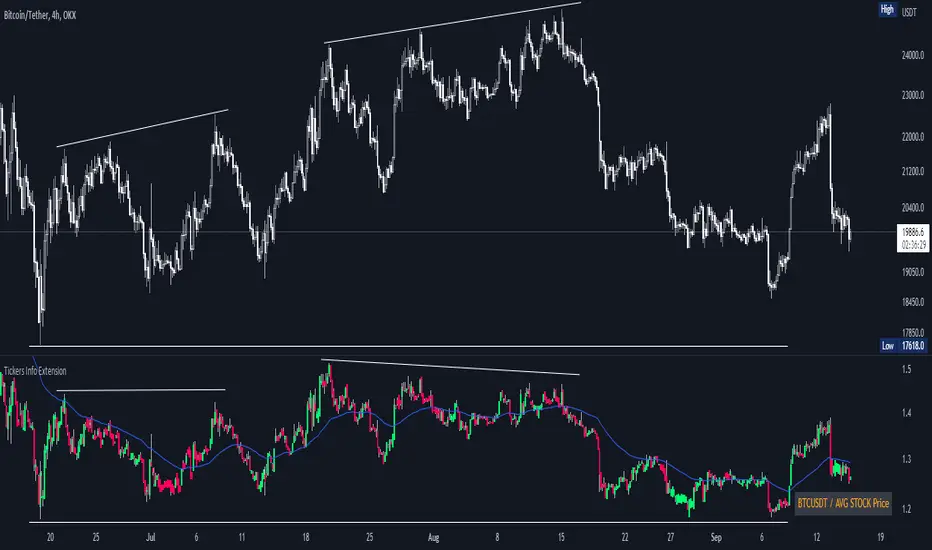
I also want to show an example from personal experience how you can use this indicator. I posted an idea where I compared BITCOIN and the average price of the stock market ((DJI + SPX + NDQ) / 3).Idea:

I immediately marked interesting levels and started waiting.
The result :
https://www.tradingview.com/x/TGh03xXv
Nota Keluaran
Nothing global. I just updated the code to something simpler and more readable.Also recommend reading my new work "Aggregated Volume"
https://www.tradingview.com/script/T6dlVzTV-Aggregated-Volume-CVD-Liquidations-Delta/
Nota Keluaran
Small fix for Type Symbol.Nota Keluaran
- Code Refactor. The code became simpler and even more readable.
- Removed the ability to select the graph type "Logarithmic" and "Linear". The default is "Linear".
-(Removed due to logarithmic calculation errors on some graphs. Nothing critical, just sometimes the price was shown incorrectly.) - You can still manually select the type of chart by right-clicking on the scale of the indicator.
Skrip sumber terbuka
Dalam semangat TradingView sebenar, pencipta skrip ini telah menjadikannya sumber terbuka, jadi pedagang boleh menilai dan mengesahkan kefungsiannya. Terima kasih kepada penulis! Walaupuan anda boleh menggunakan secara percuma, ingat bahawa penerbitan semula kod ini tertakluk kepada Peraturan Dalaman.
Penafian
Maklumat dan penerbitan adalah tidak bertujuan, dan tidak membentuk, nasihat atau cadangan kewangan, pelaburan, dagangan atau jenis lain yang diberikan atau disahkan oleh TradingView. Baca lebih dalam Terma Penggunaan.