OPEN-SOURCE SCRIPT
Transient Impact Model [ScorsoneEnterprises]
This indicator is an implementation of the Transient Impact Model. This tool is designed to show the strength the current trades have on where price goes before they decay.
Here are links to more sophisticated research articles about Transient Impact Models than this post arxiv.org/pdf/2205.00494 and arxiv.org/pdf/1305.4013
The way this tool is supposed to work in a simple way, is when impact is high price is sensitive to past volume, past trades being placed. When impact is low, it moves in a way that is more independent from past volume. In a more sophisticated system, perhaps transient impact should be calculated for each trade that is placed, not just the total volume of a past bar. I didn't do it to ensure parameters exist and aren’t na, as well as to have more iterations for optimization. Note that the value will change as volume does, as soon as a new candle occurs with no volume, the values could be dramatically different.
How it works
There are a few components to this script, so we’ll go into the equation and then the other functions used in this script.
Pine Script®
The parameters alpha, beta, and lambda all represent a different real thing.
Alpha (α):
Represents the instantaneous impact coefficient. It quantifies the immediate effect of the current volume on the price change. In the equation, instantaneous = alpha * volume[0], alpha scales the current bar's volume (volume[0]) to determine how much of the price change is due to immediate market impact. A larger alpha suggests that current volume has a stronger instantaneous influence on price.
Beta (β):
Represents the transient impact coefficient.It measures the lingering effect of past volumes on the current price change. In the loop calculating transient, beta * volume[t] * math.exp(-lambda_ * t) shows that beta scales the volume from previous bars (volume[t]), contributing to a decaying effect over time. A higher beta indicates a stronger influence from past volumes, though this effect diminishes with time due to the exponential decay factor.
Lambda (λ):
Represents the decay rate of the transient impact.It controls how quickly the influence of past volumes fades over time in the transient component. In the term math.exp(-lambda_ * t), lambda determines the rate of exponential decay, where t is the time lag (in bars). A larger lambda means the impact of past volumes decays faster, while a smaller lambda implies a longer-lasting effect.
So in full.
The instantaneous term, alpha * volume[0], captures the immediate price impact from the current volume.
The transient term, sum of beta * volume[t] * math.exp(-lambda_ * t) over the lookback period, models the cumulative, decaying effect of past volumes.
The total predicted_change combines these two components and is compared to the actual price change to compute an error term, math.pow(price_change - predicted_change, 2), which the script minimizes to optimize alpha, beta, and lambda.
Other parts of the script.
Objective function:
This is a wrapper function with a function to minimize so we get the best alpha, beta, and lambda values. In this case it is the Transient Impact Function, not something like a log-likelihood function, helps with efficiency for a high iteration count.
Finite Difference Gradient:
This function calculates the gradient of the objective function we spoke about. The gradient is like a directional derivative. Which is like the direction of the rate of change. Which is like the direction of the slope of a hill, we can go up or down a hill. It nudges around the parameter, and calculates the derivative of the parameter. The array of these nudged around parameters is what is returned after they are optimized.
Minimize:
This is the function that actually has the loop and calls the Finite Difference Gradient each time. Here is where the minimizing happens, how we go down the hill. If we are below a tolerance, we are at the bottom of the hill.
Applied
After an initial guess, we optimize the parameters and get the transient impact value. This number is huge, so we apply a log to it to make it more readable. From here we need some way to tell if the value is low or high. We shouldn’t use standard deviation because returns are not normally distributed, an IQR is similar and better for non normal data. We store past transient impact values in an array, so that way we can see the 25th and 90th percentiles of the data as a rolling value. If the current transient impact is above the 90th percentile, it is notably high. If below the 25th percentile, notably low. All of these values are plotted so we can use it as a tool.
Tool examples:
The idea around it is that when impact is low, there is room for big money to get size quickly and move prices around.

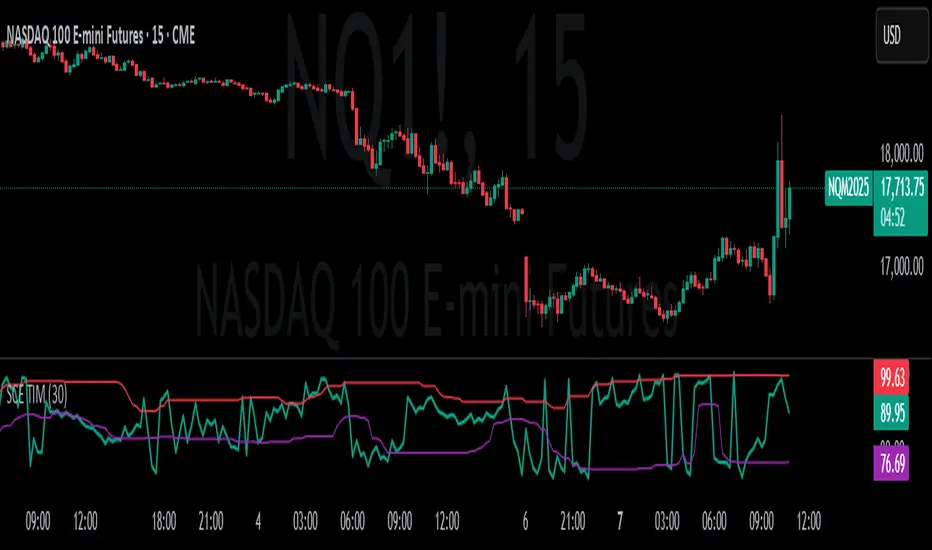
Here we see the price reacting in the IQR Bands. We see multiple examples where the value above the 90th percentile, the red line, corresponds to continuations in the trend, and below the 25th percentile, the purple line, corresponds to reversals. There is no guarantee these tools will be perfect, that is outlined in these situations, however there is clearly a correlation in this tool and trend.

This tool works on any timeframe, daily as we saw before, or lower like a two minute. The bands don’t represent a direction, like bullish or bearish, we need to determine that by interpreting price action. We see at open and at close there are the highest values for the transient impact. This is to be expected as these are the times with the highest volume of the trading day.

This works on futures as well as equities with the same context. Volume can be attributed to volatility as well. In volatile situations, more volatility comes in, and we can perceive it through the transient impact value.
Inputs
Users can enter the lookback value.
No tool is perfect, the transient impact value is also not perfect and should not be followed blindly. It is good to use any tool along with discretion and price action.
Here are links to more sophisticated research articles about Transient Impact Models than this post arxiv.org/pdf/2205.00494 and arxiv.org/pdf/1305.4013
The way this tool is supposed to work in a simple way, is when impact is high price is sensitive to past volume, past trades being placed. When impact is low, it moves in a way that is more independent from past volume. In a more sophisticated system, perhaps transient impact should be calculated for each trade that is placed, not just the total volume of a past bar. I didn't do it to ensure parameters exist and aren’t na, as well as to have more iterations for optimization. Note that the value will change as volume does, as soon as a new candle occurs with no volume, the values could be dramatically different.
How it works
There are a few components to this script, so we’ll go into the equation and then the other functions used in this script.
// Transient Impact Model
transient_impact(params, price_change, lkb) =>
alpha = array.get(params, 0)
beta = array.get(params, 1)
lambda_ = array.get(params, 2)
instantaneous = alpha * volume[0]
transient = 0.0
for t = 1 to lkb - 1
if na(volume[t])
break
transient := transient + beta * volume[t] * math.exp(-lambda_ * t)
predicted_change = instantaneous + transient
math.pow(price_change - predicted_change, 2)
The parameters alpha, beta, and lambda all represent a different real thing.
Alpha (α):
Represents the instantaneous impact coefficient. It quantifies the immediate effect of the current volume on the price change. In the equation, instantaneous = alpha * volume[0], alpha scales the current bar's volume (volume[0]) to determine how much of the price change is due to immediate market impact. A larger alpha suggests that current volume has a stronger instantaneous influence on price.
Beta (β):
Represents the transient impact coefficient.It measures the lingering effect of past volumes on the current price change. In the loop calculating transient, beta * volume[t] * math.exp(-lambda_ * t) shows that beta scales the volume from previous bars (volume[t]), contributing to a decaying effect over time. A higher beta indicates a stronger influence from past volumes, though this effect diminishes with time due to the exponential decay factor.
Lambda (λ):
Represents the decay rate of the transient impact.It controls how quickly the influence of past volumes fades over time in the transient component. In the term math.exp(-lambda_ * t), lambda determines the rate of exponential decay, where t is the time lag (in bars). A larger lambda means the impact of past volumes decays faster, while a smaller lambda implies a longer-lasting effect.
So in full.
The instantaneous term, alpha * volume[0], captures the immediate price impact from the current volume.
The transient term, sum of beta * volume[t] * math.exp(-lambda_ * t) over the lookback period, models the cumulative, decaying effect of past volumes.
The total predicted_change combines these two components and is compared to the actual price change to compute an error term, math.pow(price_change - predicted_change, 2), which the script minimizes to optimize alpha, beta, and lambda.
Other parts of the script.
Objective function:
This is a wrapper function with a function to minimize so we get the best alpha, beta, and lambda values. In this case it is the Transient Impact Function, not something like a log-likelihood function, helps with efficiency for a high iteration count.
Finite Difference Gradient:
This function calculates the gradient of the objective function we spoke about. The gradient is like a directional derivative. Which is like the direction of the rate of change. Which is like the direction of the slope of a hill, we can go up or down a hill. It nudges around the parameter, and calculates the derivative of the parameter. The array of these nudged around parameters is what is returned after they are optimized.
Minimize:
This is the function that actually has the loop and calls the Finite Difference Gradient each time. Here is where the minimizing happens, how we go down the hill. If we are below a tolerance, we are at the bottom of the hill.
Applied
After an initial guess, we optimize the parameters and get the transient impact value. This number is huge, so we apply a log to it to make it more readable. From here we need some way to tell if the value is low or high. We shouldn’t use standard deviation because returns are not normally distributed, an IQR is similar and better for non normal data. We store past transient impact values in an array, so that way we can see the 25th and 90th percentiles of the data as a rolling value. If the current transient impact is above the 90th percentile, it is notably high. If below the 25th percentile, notably low. All of these values are plotted so we can use it as a tool.
Tool examples:
The idea around it is that when impact is low, there is room for big money to get size quickly and move prices around.
Here we see the price reacting in the IQR Bands. We see multiple examples where the value above the 90th percentile, the red line, corresponds to continuations in the trend, and below the 25th percentile, the purple line, corresponds to reversals. There is no guarantee these tools will be perfect, that is outlined in these situations, however there is clearly a correlation in this tool and trend.
This tool works on any timeframe, daily as we saw before, or lower like a two minute. The bands don’t represent a direction, like bullish or bearish, we need to determine that by interpreting price action. We see at open and at close there are the highest values for the transient impact. This is to be expected as these are the times with the highest volume of the trading day.
This works on futures as well as equities with the same context. Volume can be attributed to volatility as well. In volatile situations, more volatility comes in, and we can perceive it through the transient impact value.
Inputs
Users can enter the lookback value.
No tool is perfect, the transient impact value is also not perfect and should not be followed blindly. It is good to use any tool along with discretion and price action.
Skrip sumber terbuka
Dalam semangat TradingView sebenar, pencipta skrip ini telah menjadikannya sumber terbuka, jadi pedagang boleh menilai dan mengesahkan kefungsiannya. Terima kasih kepada penulis! Walaupuan anda boleh menggunakan secara percuma, ingat bahawa penerbitan semula kod ini tertakluk kepada Peraturan Dalaman.
Penafian
Maklumat dan penerbitan adalah tidak bertujuan, dan tidak membentuk, nasihat atau cadangan kewangan, pelaburan, dagangan atau jenis lain yang diberikan atau disahkan oleh TradingView. Baca lebih dalam Terma Penggunaan.