OPEN-SOURCE SCRIPT
MA Cross Heatmap
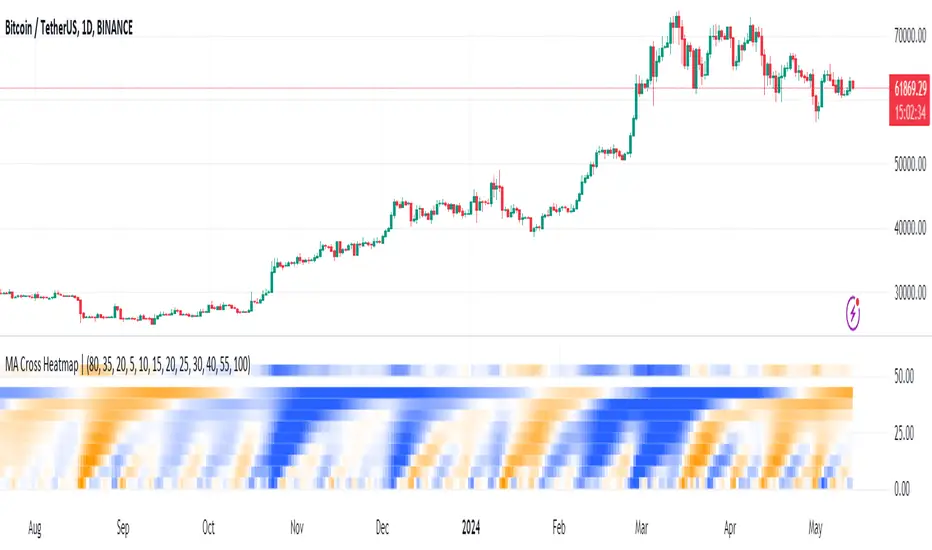
The Moving Average Cross Heatmap Created by Technicator, visualizes the crossing distances between multiple moving averages using a heat map style color coding.
The main purpose of this visualization is to help identify potential trend changes or trading opportunities by looking at where the moving averages cross over each other.
Key Features:
This is a unique way to combine multiple MA analysis with a visual heat map representation on one indicator. The code allows you to fine-tune the parameters to suit your trading style and preferences. Worth checking out if you trade using multiple moving average crossovers as part of your strategy.
The main purpose of this visualization is to help identify potential trend changes or trading opportunities by looking at where the moving averages cross over each other.
Key Features:
- Can plot up to 9 different moving average with their cross lengths you set
- Uses a heat map to show crossing distances between the MAs
- Adjustable settings like crossing length percentage, color scheme, color ceiling etc.
- Overlay style separates the heat map from the price chart
This is a unique way to combine multiple MA analysis with a visual heat map representation on one indicator. The code allows you to fine-tune the parameters to suit your trading style and preferences. Worth checking out if you trade using multiple moving average crossovers as part of your strategy.
Skrip sumber terbuka
Dalam semangat sebenar TradingView, pencipta skrip ini telah menjadikannya sumber terbuka supaya pedagang dapat menilai dan mengesahkan kefungsiannya. Terima kasih kepada penulis! Walaupun anda boleh menggunakannya secara percuma, ingat bahawa menerbitkan semula kod ini adalah tertakluk kepada Peraturan Dalaman kami.
Penafian
Maklumat dan penerbitan adalah tidak dimaksudkan untuk menjadi, dan tidak membentuk, nasihat untuk kewangan, pelaburan, perdagangan dan jenis-jenis lain atau cadangan yang dibekalkan atau disahkan oleh TradingView. Baca dengan lebih lanjut di Terma Penggunaan.