OPEN-SOURCE SCRIPT
Telah dikemas kini High/Low last 1-3 candles

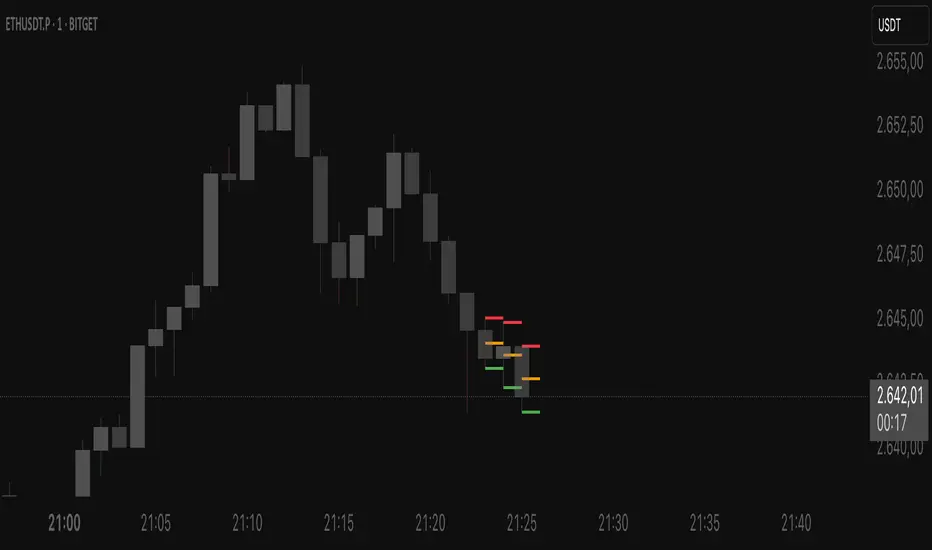
Here you can display the high and low of the last 1, 2 or 3 candles. The whole thing is updated with every new candle. you can also switch the lines on or off as you wish and adjust the colour of the lines. have fun with it
Nota Keluaran
Dynamic Candle Levels — High/Low & 50% Lines LiveThis indicator dynamically visualizes the key price levels of the current and recent candles in real-time.
Automatically draws lines at the highs and lows of the last X candles
Marks the 50% level of each candle with horizontal lines
Updates the lines of the currently forming candle live as high, low, and midpoint change
Fully customizable colors, line widths, and number of displayed candles
Perfect for quickly identifying support and resistance zones or intermediate levels at a glance to make faster trading decisions.
Settings:
Number of candles for high/low and 50% lines
Colors and widths of the lines
Option to show live lines for the current candle
Skrip sumber terbuka
Dalam semangat TradingView sebenar, pencipta skrip ini telah menjadikannya sumber terbuka, jadi pedagang boleh menilai dan mengesahkan kefungsiannya. Terima kasih kepada penulis! Walaupuan anda boleh menggunakan secara percuma, ingat bahawa penerbitan semula kod ini tertakluk kepada Peraturan Dalaman.
Penafian
Maklumat dan penerbitan adalah tidak bertujuan, dan tidak membentuk, nasihat atau cadangan kewangan, pelaburan, dagangan atau jenis lain yang diberikan atau disahkan oleh TradingView. Baca lebih dalam Terma Penggunaan.