OPEN-SOURCE SCRIPT
Telah dikemas kini RSI Trendspotter
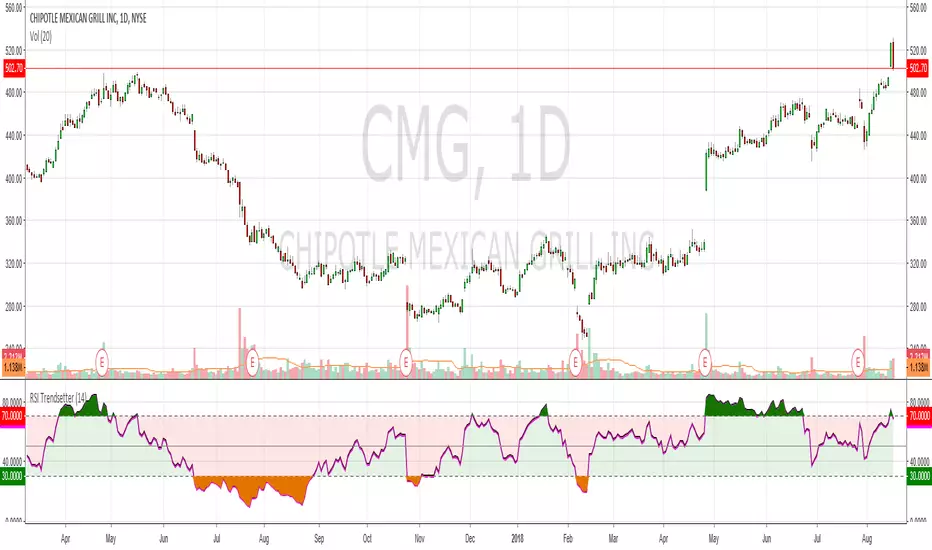
Had a bit of a TA epiphany with RSI so bear with me. The time since RSI was last overbought/sold is a solid trend indicator. This may seem obvious but after x number of years trading it hit me like a smack in the face. I've coded this for easy visualisation. They're fairly simple changes but it's making a big difference in my trendspotting already.
In the example CMG hasn't been overbought for 183 days, so the RSI is mostly green:
Before that it hadn't been oversold for 199 days, so RSI is mostly red:
And before that it was ranging like a maf*ckin' sine wave, so the RSI shows green, red, green, red, etc.:
Finally, normal RSI for comparison. Same data, but now with pretty colours:
I've also added overbought/oversold highlights cause that just makes the whole charting thing a lot easier. Enjoy!
Nota Keluaran
Bugger, I said overbought when I mean oversold and vice-versaNota Keluaran
Added plot descriptions so peeps and change colours easily. Thanks to FLOW for the feedbackNota Keluaran
Fixed an issue with colour and the source. Due to Pine Script limitations it's not possible to make this look the same on a black chart, so you will need to manually adjust the colours when you add it to your chartSkrip sumber terbuka
Dalam semangat sebenar TradingView, pencipta skrip ini telah menjadikannya sumber terbuka supaya pedagang dapat menilai dan mengesahkan kefungsiannya. Terima kasih kepada penulis! Walaupun anda boleh menggunakannya secara percuma, ingat bahawa menerbitkan semula kod ini adalah tertakluk kepada Peraturan Dalaman kami.
Penafian
Maklumat dan penerbitan adalah tidak dimaksudkan untuk menjadi, dan tidak membentuk, nasihat untuk kewangan, pelaburan, perdagangan dan jenis-jenis lain atau cadangan yang dibekalkan atau disahkan oleh TradingView. Baca dengan lebih lanjut di Terma Penggunaan.
Skrip sumber terbuka
Dalam semangat sebenar TradingView, pencipta skrip ini telah menjadikannya sumber terbuka supaya pedagang dapat menilai dan mengesahkan kefungsiannya. Terima kasih kepada penulis! Walaupun anda boleh menggunakannya secara percuma, ingat bahawa menerbitkan semula kod ini adalah tertakluk kepada Peraturan Dalaman kami.
Penafian
Maklumat dan penerbitan adalah tidak dimaksudkan untuk menjadi, dan tidak membentuk, nasihat untuk kewangan, pelaburan, perdagangan dan jenis-jenis lain atau cadangan yang dibekalkan atau disahkan oleh TradingView. Baca dengan lebih lanjut di Terma Penggunaan.