OTC COT / smart money Index 2.0
📈 Description:
This indicator focuses on visualizing net positions held by commercials (smart money) and other key market participants, using data from the Commitments of Traders (COT) report. Inspired by Bernd Skorupinski’s institutional approach, the tool works hand-in-hand with the COT Index to provide a full picture of institutional sentiment and positioning strength.
👉 Core Functionality:
Displays net-long and net-short positions over time, helping traders understand how heavily institutions are positioned in a market.
Highlights historical extremes in net positions, which can act as warning signs or entry points when combined with technical analysis.
Supports customizable timeframes and asset selection (commodities, forex, indices) for maximum flexibility.
Best used in combination with the COT Index, offering a layered view of both relative extremes (COT Index) and absolute exposure (Net Positions).
The tool is designed to act as a contextual filter—it should complement technical setups rather than provide standalone trade signals.
📊 Applied Example – Gold Trade Using COT Net Position Analysis
To show the practical application, here’s a breakdown of a Gold (GC1!) trade that leveraged both COT Index and COT Net Positions to identify a high-probability setup.
Step 1️⃣ – Identifying Technical Structure:
The analysis started with classic price action review: Gold was approaching a significant demand zone, a well-established area that has historically triggered institutional buying.
Step 2️⃣ – COT Index Confirmation:
Upon reviewing the COT Index, the data revealed a 312-week buying extreme—the most aggressive commercial buying seen in over six years, signaling strong institutional accumulation.
Step 3️⃣ – COT Net Positions Validation:
Next, the COT Net Position Indicator showed that commercials were holding their largest net-long position in over 15 years—a rare and powerful signal of institutional conviction.
Step 4️⃣ – Divergence Check:
For added confirmation, divergence between commercials and retail traders was assessed:
✅ Commercials: Strongly net-long.
❌ Retail traders: Heavily net-short.
This clear divergence between smart money and retail sentiment further validated the setup.
Step 5️⃣ – Trade Execution:
With everything aligned:
Demand zone identified,
312-week COT Index extreme,
15-year high in net positions,
Divergence between commercials and retail,
…the trade was entered with a stop-loss placed just below the demand zone and a target set at a significant prior high. The result: a risk-reward ratio of 1:14.8, reflecting the strength and precision of the setup.
⚙️ What Sets This Tool Apart:
Provides deep insight into institutional exposure, showing both the magnitude of positions and how they evolve over time.
Enhances decision-making by cross-validating positioning extremes with technical levels.
Flexible design allows use across multiple asset classes and timeframes.
📌 Best Practices:
Always pair COT Net Position data with the COT Index to gauge both relative and absolute strength.
Use in conjunction with demand/supply zones or key technical levels for the strongest setups.
Look for divergence signals (institutions vs. retail) to confirm potential reversals.
Indicators Used in the Example:
This trade combined:
🧠 COT Net Position Indicator – to measure institutional exposure.
📊 COT Index – to identify positioning extremes.
📅 Seasonality Forecasting Tool – for time-based confirmation.
Together, these indicators provided a robust, multi-layered framework for high-confidence trading decisions.
COT/ Smart money Indicator – Institutional Commitment & Position Sizing (Inspired by Bernd Skorupinski Methodology)
📈 Description:
This indicator focuses on visualizing net positions held by commercials (smart money) and other key market participants, using data from the Commitments of Traders (COT) report. Inspired by Bernd Skorupinski’s institutional approach, the tool works hand-in-hand with the COT Index to provide a full picture of institutional sentiment and positioning strength.
👉 Core Functionality:
Displays net-long and net-short positions over time, helping traders understand how heavily institutions are positioned in a market.
Highlights historical extremes in net positions, which can act as warning signs or entry points when combined with technical analysis.
Supports customizable timeframes and asset selection (commodities, forex, indices) for maximum flexibility.
Best used in combination with the COT Index, offering a layered view of both relative extremes (COT Index) and absolute exposure (Net Positions).
The tool is designed to act as a contextual filter—it should complement technical setups rather than provide standalone trade signals.
📊 Applied Example – Gold Trade Using COT Net Position Analysis
To show the practical application, here’s a breakdown of a Gold (GC1!) trade that leveraged both COT Index and COT Net Positions to identify a high-probability setup.
Step 1️⃣ – Identifying Technical Structure:
The analysis started with classic price action review: Gold was approaching a significant demand zone, a well-established area that has historically triggered institutional buying.
Step 2️⃣ – COT Index Confirmation:
Upon reviewing the COT Index, the data revealed a 312-week buying extreme—the most aggressive commercial buying seen in over six years, signaling strong institutional accumulation.
Step 3️⃣ – COT Net Positions Validation:
Next, the COT Net Position Indicator showed that commercials were holding their largest net-long position in over 15 years—a rare and powerful signal of institutional conviction.
Step 4️⃣ – Divergence Check:
For added confirmation, divergence between commercials and retail traders was assessed:
✅ Commercials: Strongly net-long.
❌ Retail traders: Heavily net-short.
This clear divergence between smart money and retail sentiment further validated the setup.
Step 5️⃣ – Trade Execution:
With everything aligned:
Demand zone identified,
312-week COT Index extreme,
15-year high in net positions,
Divergence between commercials and retail,
…the trade was entered with a stop-loss placed just below the demand zone and a target set at a significant prior high. The result: a risk-reward ratio of 1:14.8, reflecting the strength and precision of the setup.
⚙️ What Sets This Tool Apart:
Provides deep insight into institutional exposure, showing both the magnitude of positions and how they evolve over time.
Enhances decision-making by cross-validating positioning extremes with technical levels.
Flexible design allows use across multiple asset classes and timeframes.
📌 Best Practices:
Always pair COT Net Position data with the COT Index to gauge both relative and absolute strength.
Use in conjunction with demand/supply zones or key technical levels for the strongest setups.
Look for divergence signals (institutions vs. retail) to confirm potential reversals.
Indicators Used in the Example:
This trade combined:
🧠 COT Net Position Indicator – to measure institutional exposure.
📊 COT Index – to identify positioning extremes.
📅 Seasonality Forecasting Tool – for time-based confirmation.
Together, these indicators provided a robust, multi-layered framework for high-confidence trading decisions.
Look back 6 months to 3 years for extremes.
6 months if you are following the trend
3 years if you are for market shift
✅ Above 80 = bullish extreme (commercials heavily long).
🔻 Below 20 = bearish extreme (commercials heavily short).
🚦 Use these extremes to spot possible market turning points.
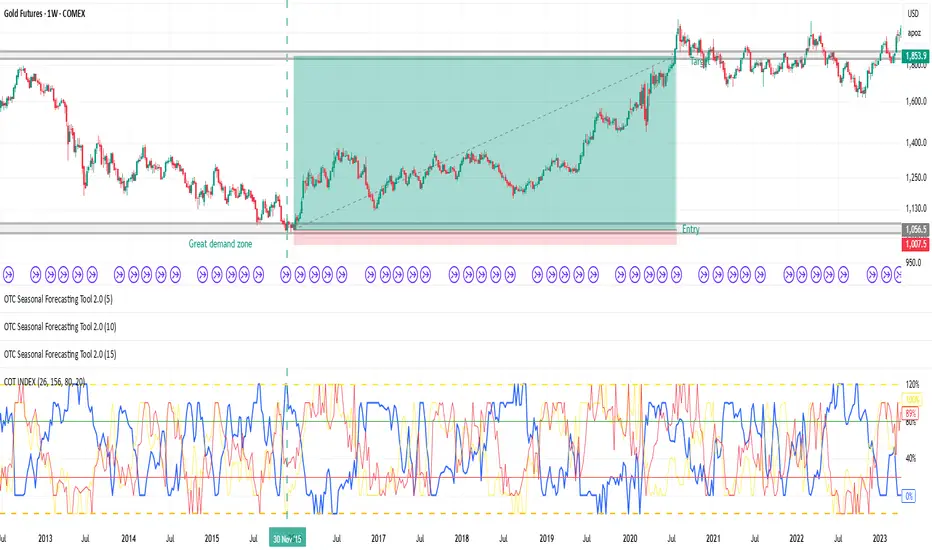
Example on Gold
When it comes to trading commodities like Gold and Crude Oil, I follow a process rooted in institutional data — specifically, the Commitments of Traders (COT) report. Through the Online Trading Campus tools developed by Bernd Skorupinski, I combine insights from the Valuation Tool, Seasonality Forecasting Tool, and COT Analysis for a refined edge.
📈 Step 1: Technical Demand Zone
The first thing I do is analyze price action. In this Gold trade, I spotted price approaching a key demand level — a zone where price has historically reacted due to large institutional buying.
🟢 Chart Insight: Price was reaching a long-term demand zone dating back several years.
🧠 Step 2: COT Index – Institutional Extreme
Next, I bring up the COT Index, specifically using the CAMPUS COT Index indicator. What I saw here was powerful:
The commercials (smart money) were at a 312-week buying extreme — meaning they haven’t been buying this aggressively in over 6 years.
This is a major institutional footprint. Historically, when commercials are at or above 100%, price often follows shortly after with strong moves.
📊 Step 3: COT Net Positions
To strengthen my case, I checked the COT Net Positions. Here's where it got interesting:
Commercials hadn’t held this many net-long positions since 15 years ago.
📉 That’s rare. When something like this aligns with price at a demand level — it’s a green light.
🔁 Step 4: COT Index Divergence
For final confirmation, I look for divergence between commercials and retailers.
✅ In this case, commercials were buying heavily
❌ Retail traders were shorting heavily
This opposite behavior (smart money vs. dumb money) is my cue to prepare a trade.
🎯 Step 5: Entry, Target & Risk
Once all conditions align:
✅ Demand level confirmed
✅ 312-week commercial extreme
✅ 15-year net position high
✅ Retailers on the other side
…I set up the trade.
📌 Stop-loss: Just below demand
🎯 Target: Previous major high
📈 RRR (Risk/Reward): 1:14.8
That means for every 1% risked, I stood to gain nearly 15%. And yes — this trade hit full target.
📢 Why This Matters
This is not about guessing. It’s about:
Following institutional footprints
Using retail sentiment as confirmation
Aligning multiple data points (price, time, net positions)
Bernd Skorupinski’s tools make this process repeatable.
Skrip jemputan sahaja
Hanya pengguna disahkan oleh penulis boleh mengakses skrip ini. Anda perlu memohon dan mendapatkan kebenaran untuk menggunakannya. Keizinan selalunya diberikan selepas pembayaran. Untuk lebih butiran, ikuti arahan penulis di bawah atau hubungi Nikhichuanhal655 secara terus.
TradingView TIDAK menyarankan pembayaran atau penggunaan skrip kecuali anda mempercayai sepenuhnya penulis dan memahami bagaimana ia berfungsi. Anda juga boleh menjumpai alternatif sumber terbuka dan percuma yang lain di dalam skrip komuniti kami.
Arahan penulis
Penafian
Skrip jemputan sahaja
Hanya pengguna disahkan oleh penulis boleh mengakses skrip ini. Anda perlu memohon dan mendapatkan kebenaran untuk menggunakannya. Keizinan selalunya diberikan selepas pembayaran. Untuk lebih butiran, ikuti arahan penulis di bawah atau hubungi Nikhichuanhal655 secara terus.
TradingView TIDAK menyarankan pembayaran atau penggunaan skrip kecuali anda mempercayai sepenuhnya penulis dan memahami bagaimana ia berfungsi. Anda juga boleh menjumpai alternatif sumber terbuka dan percuma yang lain di dalam skrip komuniti kami.