PROTECTED SOURCE SCRIPT
Nyx-AI Market Intelligence Dashboard
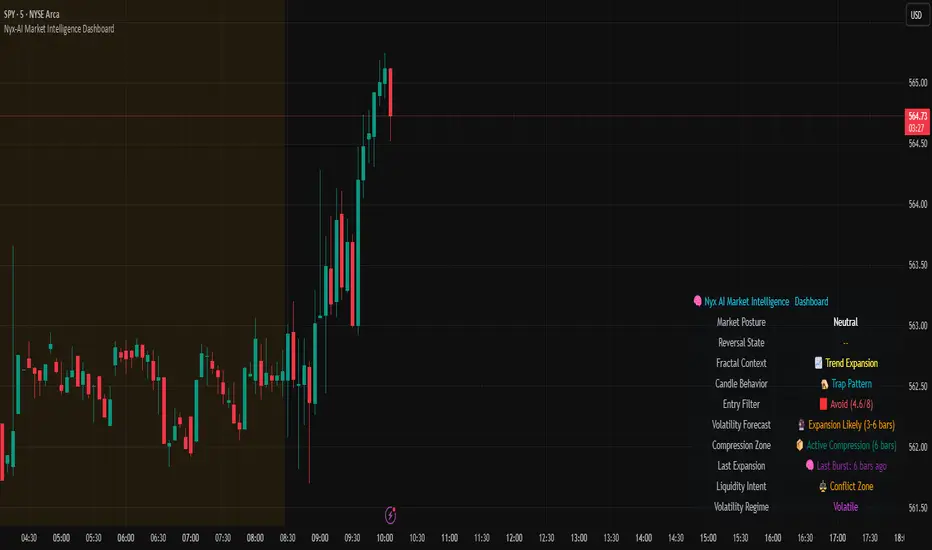
Nyx AI Market Intelligence Dashboard is a non-signal-based environmental analysis tool that provides real-time insight into short-term market behavior. It is designed to help traders understand the quality of current price action, volume dynamics, volatility conditions, and structural behavior. It informs the trader whether the current market environment is supportive or hostile to trading and whether any active signal (from other tools) should be trusted, filtered, or avoided altogether.
Nyx is composed of seven intelligent modules. Each module operates independently but is visually unified through a floating dashboard panel on the chart. This panel renders live diagnostics every few bars, maintaining a low visual footprint without drawing overlays or modifying price.
Market Posture Engine
This module reads individual candlesticks using real-time candle anatomy to interpret directional bias and sentiment. It examines body-to-range ratio, wick imbalances, and compares them to prior bars. If the current candle is a large momentum body with minimal wick, it is interpreted as a directional thrust. If it is a small body with equal wicks, it is considered indecision. Engulfing patterns are used to detect potential liquidity tests. The system outputs a plain-text posture signal such as Building Bullish Intent, Bearish Momentum, Indecision Zone, Testing Liquidity (Up or Down), or Neutral.
Flow Reversal Engine
This module monitors short-term structural shifts and volume contraction to detect early signs of reversal or exhaustion. It looks for lower highs or higher lows paired with weakening volume and closing behavior that implies loss of momentum. It also monitors divergence between price and volume, as well as bar-to-bar momentum stalls (where highs and lows stop expanding). When these conditions are met, it outputs one of several states including Top Forming, Bottom Forming, Flow Divergence, Momentum Stall, or Neutral. This is useful for detecting inflection points before they manifest on trend indicators.
Fractal Context Engine
This engine compares the current bar’s range to its surrounding structural context. It uses a dynamic lookback length based on volatility. It determines whether the market is in expansion (strong directional trend), compression (shrinking range), or a transitional phase. A special case called Flip In Progress is triggered when the current high and low exceed the entire recent range, which often precedes sharp reversals or volatility expansion. The result is one of the following: Trend Expansion, Trend Breakdown, Sideways or Coil, Flip In Progress, or Expansion to Coil.
Candle Behavior Analyzer
This module analyzes the last five candles as a set to detect behavioral traits that a single candle may not reveal. It calculates average body and wick size, and counts how many recent candles show thrust (large body dominance), trap behavior (price returns inside wicks), or weakness (small bodies with high wick ratios). The module outputs one of the following behaviors: Aggressive Buying, Aggressive Selling, Trap Pattern, Trap During Coil, Low Participation, Low Energy, or Fakeout Candle. This helps the trader assess sentiment quality and the reliability of price movement.
Volatility Forecast and Compression Memory
This module predicts whether a breakout is likely based on recent compression behavior. It tracks how many of the last 10 bars had significantly reduced range compared to average. If a certain threshold is met without any recent large expansion bar, the system forecasts that a volatility expansion is likely in the near future. It also records how many bars ago the last high volatility impulse occurred and classifies whether current conditions are compressing. The outputs are Expansion Likely, Active Compression, and Last Burst memory, which provide breakout timing and energy insights.
Entry Filter
This module scores the current bar based on four adaptive criteria: body size relative to range, volume strength relative to average, current volatility versus historical volatility, and price position relative to a 20-period moving average. Each factor is scored as either 1 or 2. The total score is adjusted by a behavioral modifier that adds or subtracts a point if recent candles show aggression or trap behavior. Final scores range from 4 to 8 and are classified into Optimal, Mixed, or Avoid categories. This module is not a trade signal. It is a confluence filter that evaluates whether conditions are favorable for entry. It is particularly effective when layered with other indicators to improve precision.
Liquidity Intent Engine
This engine checks for price behavior around recent swing highs and lows. It uses adaptive pivots based on volatility to determine if price has swept above a recent high or below a recent low. This behavior is often associated with institutional liquidity hunts. If a sweep is detected and price has moved away from the sweep level, the engine infers directional intent and compares current distance to the high and low to determine which liquidity pool is more dominant. The output is Magnet Above, Magnet Below, or Conflict Zone. This is useful for anticipating directional bias driven by smart money activity.
Sticky Memory Tracking
To avoid flickering between states on low volatility or noisy price action, Nyx includes a sticky memory system. Each module’s output is preserved until a meaningful change is detected. For example, if Market Posture is Neutral and remains so for several bars, the previous non-neutral value is retained. This makes the dashboard more stable and easier to interpret without misleading noise.
Dashboard Rendering
All module outputs are displayed in a clean two-column panel anchored to any corner of the chart. Text values are color-coded, tooltips are added for context, and the data refreshes every few bars to maintain speed. The dashboard avoids clutter and blends seamlessly with other chart tools.
This tool is intended for informational and educational purposes only. It does not provide financial advice or trading signals. Nyx analyzes price, volume, structure, and volatility to offer context about the current market environment. It is not designed to predict future price movements or guarantee profitable outcomes. Traders should always use independent judgment and risk management. Past performance of any analysis logic does not guarantee future results.
Skrip dilindungi
Skrip ini diterbitkan sebagai sumber tertutup. However, you can use it freely and without any limitations – learn more here.
Penafian
The information and publications are not meant to be, and do not constitute, financial, investment, trading, or other types of advice or recommendations supplied or endorsed by TradingView. Read more in the Terms of Use.