PROTECTED SOURCE SCRIPT
Telah dikemas kini 15 Minute Touchlines
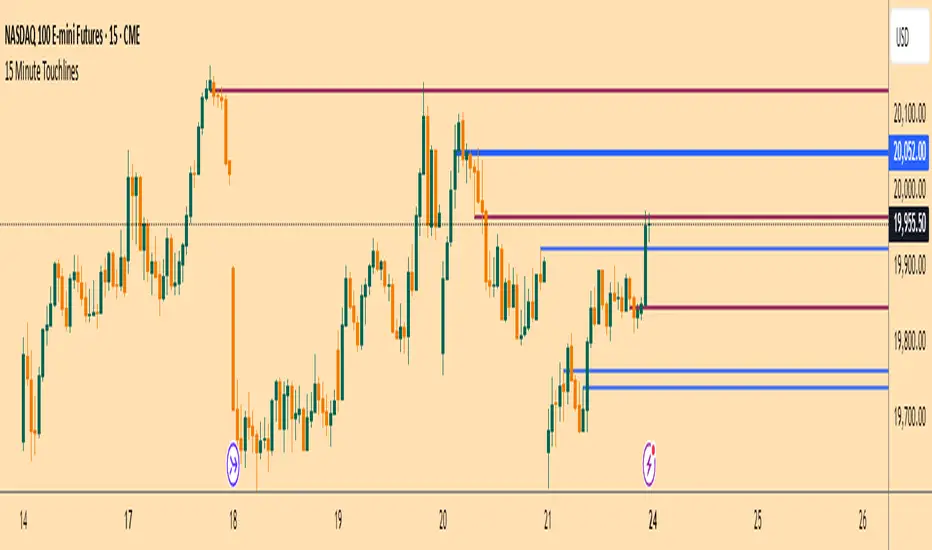
The 15 Minute Touchlines indicator is designed to identify potential breakout levels on a 15-minute timeframe, providing visual and alert-based signals for traders. This indicator overlays on the price chart and helps traders spot key levels where price may react, offering both buy and sell signals.
Key Features:
Breakout Levels:
The indicator calculates breakout levels based on recent price action, identifying potential support and resistance zones.
Up Deviation and Down Deviation parameters allow for customization of these levels.
Trend Filter:
An optional trend filter using a Simple Moving Average (SMA) can be enabled to filter out signals that do not align with the overall trend.
The trend filter helps in reducing false signals by ensuring that breakouts occur in the direction of the prevailing trend.
Visual Signals:
Lines: The indicator plots horizontal lines at identified breakout levels, which can be extended to the right.
Arrows: Optional arrows can be displayed to indicate buy or sell signals, enhancing visual clarity.
Colors: Customizable colors for buy and sell lines and arrows.
Touch Counts:
The indicator tracks the number of times price touches the plotted lines.
Users can set the number of touches required to remove a line or trigger an alert, providing flexibility in managing active levels.
Alerts:
Alerts can be configured to notify traders when price touches a line a specified number of times, aiding in timely decision-making.
Low Pass Bands:
The indicator incorporates low pass bands to smooth out price fluctuations, helping to identify more reliable breakout levels.
Customizable parameters for the low pass bands allow traders to fine-tune the indicator's sensitivity.
Input Parameters:
History Lines to Show: Number of historical lines to display.
Show Lines: Toggle to display or hide the breakout lines.
Touches to Remove Line: Number of touches required to remove a line.
Touch Number for Alert: Number of touches required to trigger an alert.
Buy/Sell Line Color: Custom colors for buy and sell lines.
Up/Down Deviation: Deviation factors for calculating breakout levels.
Extend Lines to Right: Option to extend lines to the right edge of the chart.
Line Thickness: Thickness of the plotted lines.
Use Trend SMA Filter: Toggle to enable or disable the trend filter.
Trend SMA Period: Period for the trend SMA filter.
Usage:
Identify Breakouts: Use the plotted lines and arrows to identify potential breakout levels and direction.
Trend Confirmation: Enable the trend filter to ensure that breakouts align with the overall trend.
Alert Management: Set up alerts to be notified of price interactions with key levels, aiding in active trading strategies.
The 15 Minute Touchlines indicator is a versatile tool for traders looking to capitalize on short-term price movements, offering a blend of visual signals and customizable alerts to enhance trading decisions.
Nota Keluaran
Minor Graphic ChangeNota Keluaran
Updated for MTF, since M15 is what is needed.Skrip dilindungi
Skrip ini diterbitkan sebagai sumber tertutup. Akan tetapi, anda boleh menggunakannya secara bebas dan tanpa apa-apa had – ketahui lebih di sini.
Penafian
Maklumat dan penerbitan adalah tidak bertujuan, dan tidak membentuk, nasihat atau cadangan kewangan, pelaburan, dagangan atau jenis lain yang diberikan atau disahkan oleh TradingView. Baca lebih dalam Terma Penggunaan.
Skrip dilindungi
Skrip ini diterbitkan sebagai sumber tertutup. Akan tetapi, anda boleh menggunakannya secara bebas dan tanpa apa-apa had – ketahui lebih di sini.
Penafian
Maklumat dan penerbitan adalah tidak bertujuan, dan tidak membentuk, nasihat atau cadangan kewangan, pelaburan, dagangan atau jenis lain yang diberikan atau disahkan oleh TradingView. Baca lebih dalam Terma Penggunaan.