OPEN-SOURCE SCRIPT
Finnie's HL BREAKOUT
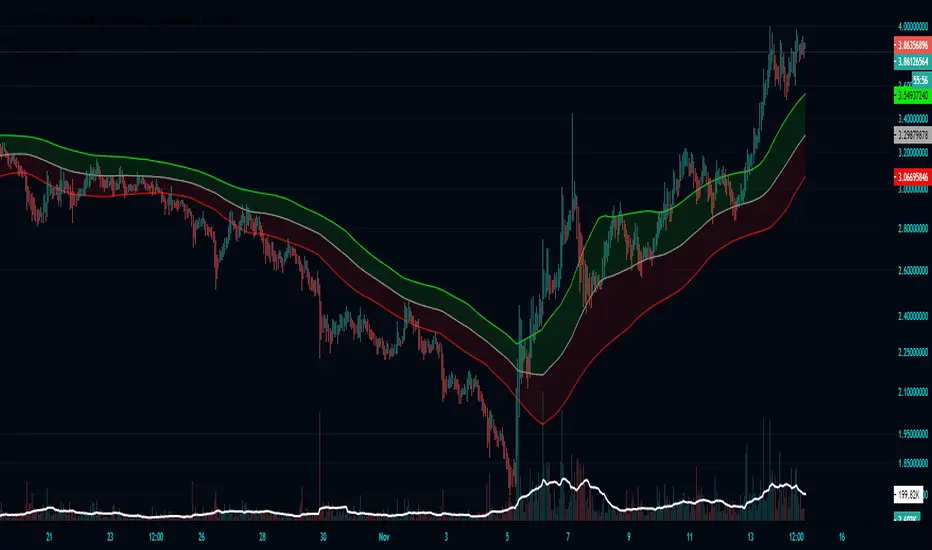
First the indicators takes a range, by default it is 22 candles, then finds the highest and lowest points of said range. At this point your left with lines that follow your support and resistance in the given range (take a look by change the 100 ema in settings to 1). To take things a step further I took a 100 candle ema of the highest highest and lowest lows to not only smooth things out, but also to provide visual ques for breakouts, when closing price is above the top band the asset is considered to be breaking out.
Skrip sumber terbuka
Dalam semangat TradingView sebenar, pencipta skrip ini telah menjadikannya sumber terbuka, jadi pedagang boleh menilai dan mengesahkan kefungsiannya. Terima kasih kepada penulis! Walaupuan anda boleh menggunakan secara percuma, ingat bahawa penerbitan semula kod ini tertakluk kepada Peraturan Dalaman.
Penafian
Maklumat dan penerbitan adalah tidak bertujuan, dan tidak membentuk, nasihat atau cadangan kewangan, pelaburan, dagangan atau jenis lain yang diberikan atau disahkan oleh TradingView. Baca lebih dalam Terma Penggunaan.