PROTECTED SOURCE SCRIPT
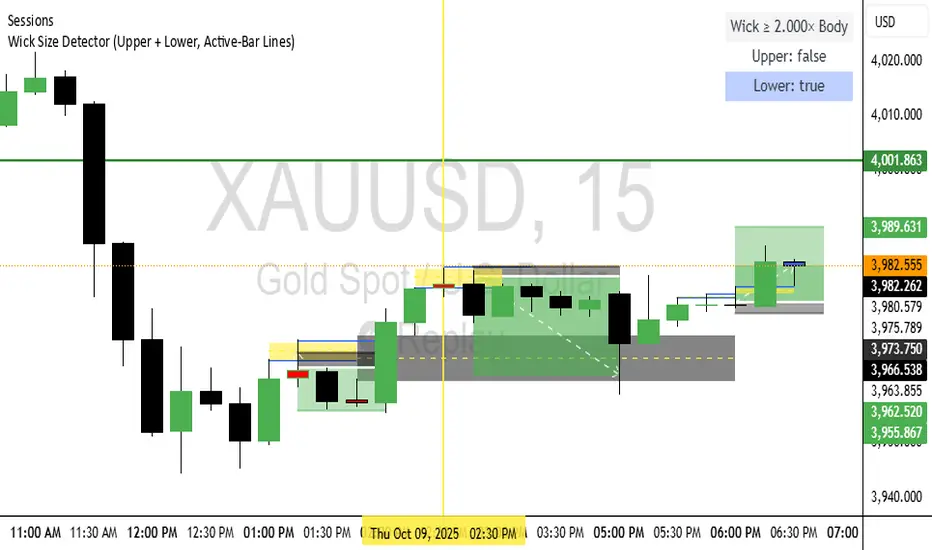
Wick Size Detector (Upper + Lower, Active-Bar Lines)
🧭 1. Understanding What the Indicator Tells You
Each signal means a potential shift in intent — a wick implies rejection of price at one extreme.
Upper Wick (red) → Sellers rejected higher prices → potential short setup.
Lower Wick (green) → Buyers rejected lower prices → potential long setup.
Dual Wick (both large) → Exhaustion / indecision → likely reversal or range start.
The wick is not a trade by itself — it’s a context clue telling you where liquidity was swept and which side failed.
🧩 2. Framework for Trading Wick Signals
Use a two-stage decision model: context → confirmation.
Stage 1: Context Filter
Before taking any wick, make sure the background aligns:
Higher timeframe (1H / 4H / Daily) bias using:
Market structure (higher highs/lows)
EMA slope or Fair Value Gap alignment
Key liquidity (PDH, PDL, Daily Open)
Example:
4H is bullish (higher lows + above 50 EMA) → focus only on green lower-wick signals.
4H is bearish → focus only on red upper-wick signals.
This avoids trading against momentum.
Stage 2: Confirmation & Entry
Once a valid wick signal appears in context:
✅ Entry Logic
Wait for candle with qualifying wick (per indicator).
On next candle:
For a lower wick (buy setup) →
Enter long near the midpoint or discount (50–62%) of the wick candle’s range.
For an upper wick (sell setup) →
Enter short near the midpoint or premium (50–62%) of the wick candle’s range.
🛑 Stop Loss
Below the wick low for buys.
Above the wick high for sells.
🎯 Take Profit
Target prior liquidity points:
For buys → previous highs or equilibrium.
For sells → previous lows or daily open.
Or use a fixed R:R (e.g., 2:1).
⚖️ Optional: Wait for Confirmation (Displacement / MSS)
If you combine this with your ICT-style workflow:
Wait for a market structure shift in direction of the wick.
Confirm the Change in State of Delivery (CISD) before entry.
🧠 3. Example Walkthrough
Setup:
You’re on the 15-minute chart, wickMultiplier = 1.2.
Price makes a big upper wick → indicator flashes red.
On 1H and 4H, you see price near a premium area or PDH.
Next candle opens → you short at the midpoint of that wick candle.
Stop above the wick high.
Take profit near the prior swing low or 2× risk distance.
If you see MSS confirmation → add confluence.
💡 4. Tips for Real Implementation
Multi-timeframe filter: Only take wick signals in alignment with HTF bias.
Session discipline: Limit signals to high-volume sessions (London / New York).
Avoid strong trend continuation candles (small wicks, big bodies).
Combine with displacement → your best trades come when a large wick forms into liquidity, then displacement confirms it.
Avoid every signal: Some wicks are just noise. Wait for those near obvious liquidity (previous highs/lows).
Skrip dilindungi
Skrip ini diterbitkan sebagai sumber tertutup. Akan tetapi, anda boleh menggunakannya dengan percuma dan tanpa had – ketahui lebih lanjut di sini.
Penafian
Maklumat dan penerbitan adalah tidak dimaksudkan untuk menjadi, dan tidak membentuk, nasihat untuk kewangan, pelaburan, perdagangan dan jenis-jenis lain atau cadangan yang dibekalkan atau disahkan oleh TradingView. Baca dengan lebih lanjut di Terma Penggunaan.