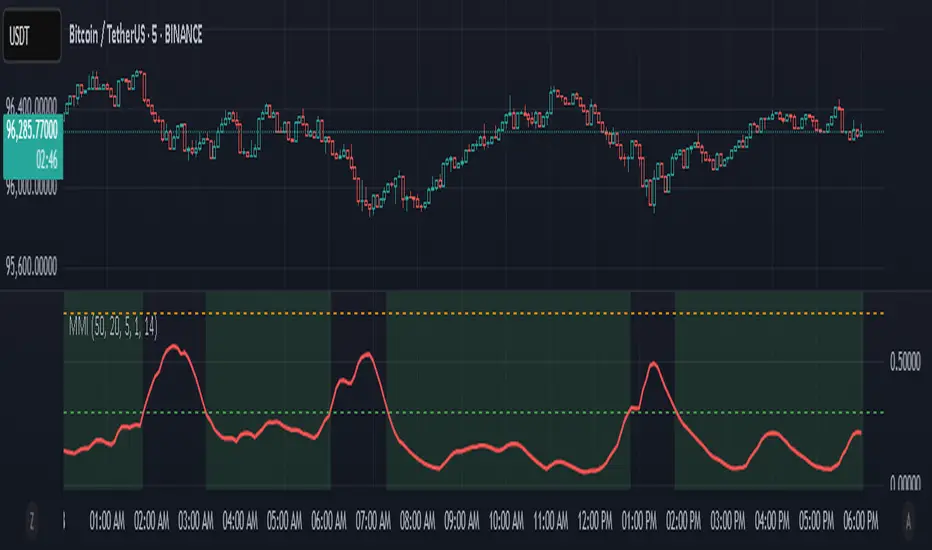
The Composite Manipulation Index (CMI) is a structural integrity tool that quantifies how chaotic or orderly current market conditions are, with the aim of detecting potentially manipulated or unstable environments. It blends two distinct mathematical models that assess price behavior in terms of both structural rhythm and predictability.
1. Sine-Fit Deviation Model:
This component assumes that ideal, low-manipulation price behavior resembles a smooth oscillation, such as a sine wave. It generates a synthetic sine wave using a user-defined period and compares it to actual price movement over an adaptive window. The error between the real price and this synthetic wave—normalized by price variance—forms the Sine-Based Manipulation Index. A high error indicates deviation from natural rhythm, suggesting structural disorder.
2. Predictability-Based Model:
The second component estimates how well current price can be predicted using recent price lags. A two-variable rolling linear regression is computed between the current price and two lagged inputs (close[1] and close[2]). If the predicted price diverges from the actual price, this error—also normalized by price variance—reflects unpredictability. High prediction error implies a more manipulated or erratic environment.
3. Adaptive Mechanism:
Both components are calculated using an adaptive smoothing window based on the Average True Range (ATR). This allows the indicator to respond proportionally to market volatility. During high volatility, the analysis window expands to avoid over-sensitivity; during calm periods, it contracts for better responsiveness.
4. Composite Output:
The two normalized metrics are averaged to form the final CMI value, which is then optionally smoothed further. The output is scaled between 0 and 1:
0 indicates a highly structured, orderly market.
1 indicates complete structural breakdown or randomness.
Suggested Interpretation:
CMI < 0.3: Market is clean and structured. Trend-following or breakout strategies may perform better.
CMI > 0.7: Market is structurally unstable. Choppy price action, fakeouts, or manipulative behavior may dominate.
CMI 0.3–0.7: Transitional zone. Caution or reduced risk may be warranted.
This indicator is designed to serve as a contextual filter, helping traders assess whether current market conditions are conducive to structured strategies, or if discretion and defense are more appropriate.
Nota Keluaran
spectral analysisSkrip sumber terbuka
Dalam semangat TradingView sebenar, pencipta skrip ini telah menjadikannya sumber terbuka, jadi pedagang boleh menilai dan mengesahkan kefungsiannya. Terima kasih kepada penulis! Walaupuan anda boleh menggunakan secara percuma, ingat bahawa penerbitan semula kod ini tertakluk kepada Peraturan Dalaman.
Penafian
Maklumat dan penerbitan adalah tidak bertujuan, dan tidak membentuk, nasihat atau cadangan kewangan, pelaburan, dagangan atau jenis lain yang diberikan atau disahkan oleh TradingView. Baca lebih dalam Terma Penggunaan.
Skrip sumber terbuka
Dalam semangat TradingView sebenar, pencipta skrip ini telah menjadikannya sumber terbuka, jadi pedagang boleh menilai dan mengesahkan kefungsiannya. Terima kasih kepada penulis! Walaupuan anda boleh menggunakan secara percuma, ingat bahawa penerbitan semula kod ini tertakluk kepada Peraturan Dalaman.
Penafian
Maklumat dan penerbitan adalah tidak bertujuan, dan tidak membentuk, nasihat atau cadangan kewangan, pelaburan, dagangan atau jenis lain yang diberikan atau disahkan oleh TradingView. Baca lebih dalam Terma Penggunaan.
