vdubus

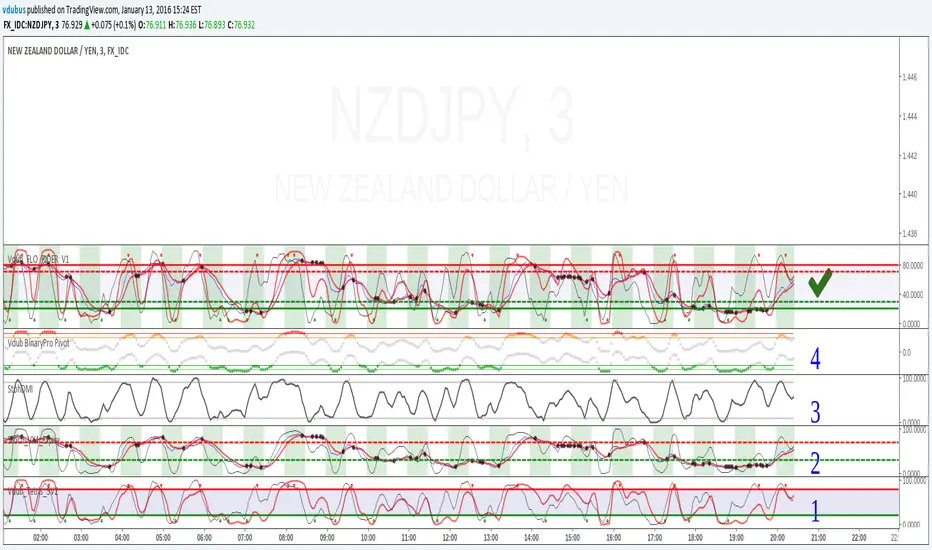
Vdub_FLO RIDER_V1

By request I have compiled everything I use to trade in to one indicator

Skrip sumber terbuka

Dalam semangat TradingView yang sebenar, penulis skrip ini telah menerbitkannya dengan menggunakan sumber terbuka supaya pedagang-pedagang dapat memahami dan mengesahkannya. Sorakan kepada penulis! Anda dapat menggunakannya secara percuma tetapi penggunaan semula kod ini dalam penerbitan adalah dikawalselia oleh Peraturan Dalaman. Anda boleh menyukainya untuk menggunakannya pada carta.

Penafian

Maklumat dan penerbitan adalah tidak dimaksudkan untuk menjadi, dan tidak membentuk, nasihat untuk kewangan, pelaburan, perdagangan dan jenis-jenis lain atau cadangan yang dibekalkan atau disahkan oleh TradingView. Baca dengan lebih lanjut di Terma Penggunaan.

Ingin menggunakan skrip ini pada carta?
//@version=2
study(title="Vdub_FLO RIDER_V1", shorttitle="Vdub_FLO_RIDER_V1", overlay=false)
// Tops & Bottoms.
pctile = input(90, title="%")
wrnpctile = input(70, title=" %")
Short = input(0.3, title="LONG")
Long = input(0.5, title="SHORT")
lkbT = input(250,title="'PRO-Top")
lkbB = input(250,title="'PRO-Bottom")
//Laguerre PPO Code from TheLark
lag(g, p) =>
    L0 = (1 - g)*p+g*nz(L0[1])
    L1 = -g*L0+nz(L0[1])+g*nz(L1[1])
    L2 = -g*L1+nz(L1[1])+g*nz(L2[1])
    L3 = -g*L2+nz(L2[1])+g*nz(L3[1])
    f = (L0 + 2*L1 + 2*L2 + L3)/6
    f
lmas = lag(Short, hl2)
lmal = lag(Long, hl2)

pctileB = pctile * -1
wrnpctileB = wrnpctile * -1

//PPO Plot
ppoT = (lmas-lmal)/lmal*100
ppoB = (lmal - lmas)/lmal*100
//PercentRank of PPO 
pctRankT = percentrank(ppoT, lkbT)
pctRankB = percentrank(ppoB, lkbB) * -1
colT = pctRankT >= pctile ? red : pctRankT >= wrnpctile and pctRankT < pctile ? red : red
plot(pctRankT,title="Percentile Rank", color=colT, style=line, linewidth=2)
//-------------------------------------------
//Original coding Khramov.Vladislav*StochDMI*AWESOME*5 min binary options*
wwma(l,p) =>
    wwma = (nz(wwma[1]) * (l - 1) + p) / l

DMIlength = input(10, title = "DMI")
Stolength = input(6, title = "DMI Stoch")
os = input (15, title = "Over Bought")
ob = input (85, title = "Over Sold")

hiDiff = high - high[1]
loDiff = low[1] - low

plusDM = (hiDiff > loDiff) and (hiDiff > 0) ? hiDiff : 0
minusDM = (loDiff > hiDiff) and (loDiff > 0) ? loDiff : 0

ATR = wwma(DMIlength, tr)

PlusDI = 100 * wwma(DMIlength,plusDM) / ATR
MinusDI = 100 * wwma(DMIlength,minusDM) / ATR

osc = PlusDI - MinusDI

hi = highest(osc, Stolength)
lo = lowest(osc, Stolength)

Stoch = sum((osc-lo),Stolength) / sum((hi-lo),Stolength) *100
plot(Stoch, color = black, title = 'Stochastic', linewidth = 1, style = line)

crossUp = Stoch[1] < os and Stoch > os ? 1 : 0
crossDo = Stoch[1] > ob and Stoch < ob ? 1 : 0

plotshape(crossUp, title="Arror up", style=shape.labelup, location=location.bottom, color=green)
plotshape(crossDo, title="Arrow down",style=shape.labeldown, location=location.top, color=red)

line2 = hline(80, linestyle=solid, color=red, linewidth = 2)
line0 = hline(20, linestyle=solid, color=green, linewidth = 2)
fill(line2, line0, transp=95)
//
length = input(21, minval=1), smoothK = input(8, minval=1), smoothD = input(5, minval=1)
k = ema(stoch(close, high, low, length), smoothK)
d = ema(k, smoothD)
plot(k, color=blue, linewidth=1)
plot(d, color=red, linewidth=2)
h0 = hline(70, color=red, linewidth=2)
h1 = hline(30, color=green, linewidth=2)
//----------------
plot(cross(d, k) ? d : na, color=black, style = circles, linewidth = 3)
OutputSignal = k >= d ? 0 : 1

//------ Back ground expiry
tf = input('30', title="BO Expiry")
tf_bool = na(tf_bool[1]) ? 0 : change(time(tf)) and tf_bool[1] == 0 ? 1 : change(time(tf)) and tf_bool[1] == 1 ? 0 : tf_bool[1]
bgcolor(tf_bool == 1 ? green : na, transp=85)