OPEN-SOURCE SCRIPT
Matrix Mod
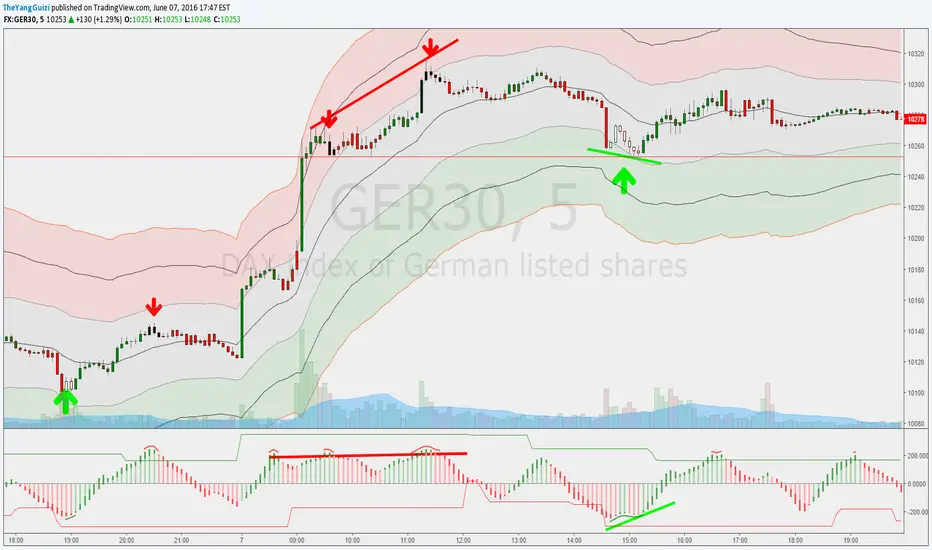
This is the Matrix oscillator made by glaz. So credit goes to him.
I made some minor modifications to it:
1. added a zeroline
2. added 3 options to color bars/candles depending on:
- if the oscillator is above/below 0
- if it's oversold/bought*
- if the matrix has a green bar or a red
That's all :)
I made some minor modifications to it:
1. added a zeroline
2. added 3 options to color bars/candles depending on:
- if the oscillator is above/below 0
- if it's oversold/bought*
- if the matrix has a green bar or a red
That's all :)
Skrip sumber terbuka
Dalam semangat sebenar TradingView, pencipta skrip ini telah menjadikannya sumber terbuka supaya pedagang dapat menilai dan mengesahkan kefungsiannya. Terima kasih kepada penulis! Walaupun anda boleh menggunakannya secara percuma, ingat bahawa menerbitkan semula kod ini adalah tertakluk kepada Peraturan Dalaman kami.
Penafian
Maklumat dan penerbitan adalah tidak dimaksudkan untuk menjadi, dan tidak membentuk, nasihat untuk kewangan, pelaburan, perdagangan dan jenis-jenis lain atau cadangan yang dibekalkan atau disahkan oleh TradingView. Baca dengan lebih lanjut di Terma Penggunaan.