OPEN-SOURCE SCRIPT
Return & Drawdown
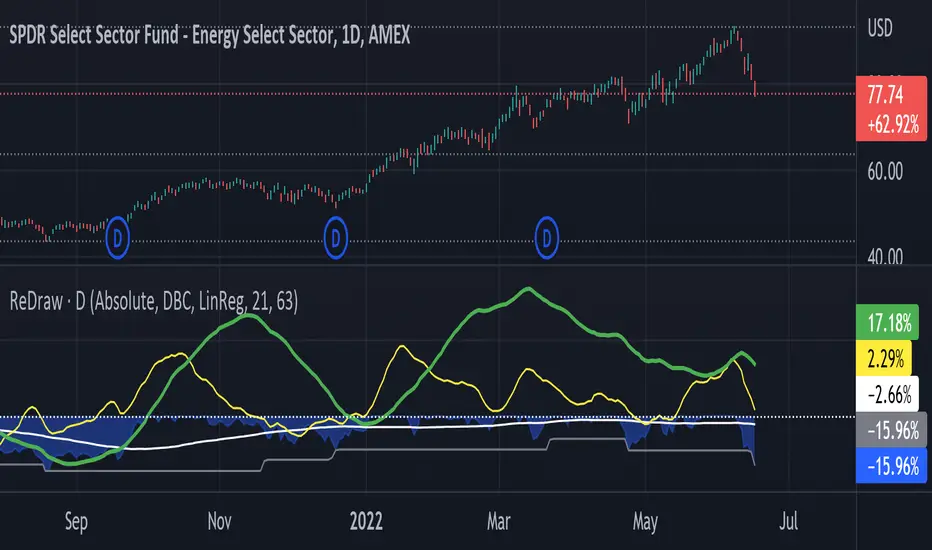
ReDraw script calculates the historical returns and drawdown for the given periods.
By default, the return of the linear regression trends is displayed (can be turned off in settings). In this mode, two linear regression trends are being computed for both long and short periods, and the percent value indicates the "return of the trend" for the corresponding period. Observing the dynamic of the linear regression trends can give a great hint if the trend is slowing down.
When the smoothing method is set to "none" or WMA3/5, the real asset return is shown for both periods, using the formula (LastPrice-FirstPrice)/FirstPrice
The script calculates the maximum drawdown for the long period using the formula (max(Price) - LastPrice) / max(Price).
The white line under the zero is the average maximum drawdown over the long period.
When the mode is set to Compare, ReDraw will display the difference in metrics between the current and selected symbol (SPY by default).
Skrip sumber terbuka
Dalam semangat sebenar TradingView, pencipta skrip ini telah menjadikannya sumber terbuka supaya pedagang dapat menilai dan mengesahkan kefungsiannya. Terima kasih kepada penulis! Walaupun anda boleh menggunakannya secara percuma, ingat bahawa menerbitkan semula kod ini adalah tertakluk kepada Peraturan Dalaman kami.
Penafian
Maklumat dan penerbitan adalah tidak dimaksudkan untuk menjadi, dan tidak membentuk, nasihat untuk kewangan, pelaburan, perdagangan dan jenis-jenis lain atau cadangan yang dibekalkan atau disahkan oleh TradingView. Baca dengan lebih lanjut di Terma Penggunaan.