OPEN-SOURCE SCRIPT
Telah dikemas kini Beta Tracker [theUltimator5]
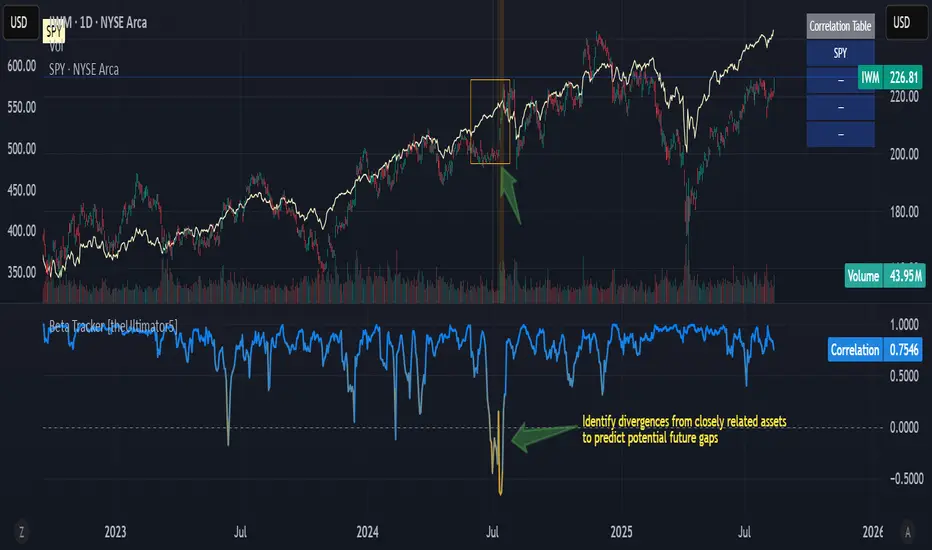
This script calculates the Pearson correlation coefficient between the charted symbol and a dynamic composite of up to four other user-defined tickers. The goal is to track how closely the current asset’s normalized price behavior aligns with, or diverges from, the selected group (or basket)
How can this indicator be valuable?
🛠️ How It Works
Blue = strongly correlated (near +1)
Orange = strongly inverse correlation (near –1)
Intermediate values fade proportionally
A highlighted background appears when the correlation drops below a user-defined threshold (e.g. –0.7), helping identify strong negative beta periods visually.
A toggleable info table displays which tickers are currently being compared, along with customizable screen positioning.
⚙️ User Inputs
https://imgur.com/a/bBQ1LUN
⚠️ Notes
How can this indicator be valuable?
- You can compare the correlation of your current symbol against a basket of other tickers to see if it is moving independently, or being pulled with the basket.... or is it moving against the basket.
- It can be used to help identify 'swap' baskets of stocks or other tickers that tend to generally move together and visually show when your current ticker diverges from the basket.
- It can be used to track beta (or negative beta) with the market or with a specific ticker.
- This is best used as a supplement to other trading signals to give a more complete picture of the external forces potentially pulling or pushing the price action of the ticker.
🛠️ How It Works
- The current symbol and each selected comparison ticker are normalized over a custom lookback window, allowing fair pattern-based comparison regardless of price scale.
- The normalized values from 1 to 4 selected tickers are averaged into a composite, which represents the group’s collective movement.
- A Pearson correlation coefficient is computed over a separate correlation lookback period, measuring the relationship between the current asset and the composite.
- The result is plotted as a dynamic line, with color gradients:
Blue = strongly correlated (near +1)
Orange = strongly inverse correlation (near –1)
Intermediate values fade proportionally
A highlighted background appears when the correlation drops below a user-defined threshold (e.g. –0.7), helping identify strong negative beta periods visually.
A toggleable info table displays which tickers are currently being compared, along with customizable screen positioning.
⚙️ User Inputs
- Ticker 1–4: Symbols to compare the current asset against (blank = ignored)
- Normalization Lookback: Period to normalize each series
- Correlation Lookback: Period over which correlation is calculated
- Negative Correlation Highlight: Toggle for background alert and threshold level
- Comparison Table: Toggle and position controls for an on-screen summary of selected tickers
https://imgur.com/a/bBQ1LUN
⚠️ Notes
- The script uses request.security() to pull data from external symbols; these must be available for the selected chart timeframe.
- A minimum of one valid ticker must be provided for the script to calculate a composite and render correlation.
Nota Keluaran
Updated chart to show indicator name in order to abide by house publishing rulesAdded labels to chart to highlight use case
Skrip sumber terbuka
Dalam semangat TradingView sebenar, pencipta skrip ini telah menjadikannya sumber terbuka, jadi pedagang boleh menilai dan mengesahkan kefungsiannya. Terima kasih kepada penulis! Walaupuan anda boleh menggunakan secara percuma, ingat bahawa penerbitan semula kod ini tertakluk kepada Peraturan Dalaman.
Penafian
Maklumat dan penerbitan adalah tidak bertujuan, dan tidak membentuk, nasihat atau cadangan kewangan, pelaburan, dagangan atau jenis lain yang diberikan atau disahkan oleh TradingView. Baca lebih dalam Terma Penggunaan.