Exhaustion Zones
This description will provide a High Level description of how our Indicator identifies and visualizes Exhaustion Zones, followed by how to use the Indicator in your trading. At the end we would like to introduce our team and experience.
High Level Description of “Exhaustion Zones”:
Our indicator is predicting the expected market volatility for a predefined period based on recent historical Volatility, which will be referred to as “Period Volatility” from now on. Currently there are two Predefined Periods…
...a daily period, which starts from 21 UTC for the next 24 hours.
...a weekly period, which starts from Sunday 21 UTC for the next 7 days.
Our indicator calculates an expected volatility for the respective period and informes you, the trader, how large the price range could be. The indicator calculates “Exhaustion Zones” using the Period Volatility, which is a multiple (1x, 2x and 3x) of the Period Volatility, based on the Period High/Low. Basically, adding the multiple of the Period Volatility to the Period Low would equate to the “Upper Exhaustion Zones”, and subtracting the multiple of the Period Volatility from the Period High would equate to the “Lower Exhaustion Zones”.
Visualisation:
Our indicator needs to display 2 states …
…price range is SMALLER than predicted Period Volatility. An example would be, a daily period has just begun, and the Daily range is small, hence the Daily range is smaller than the predicted Period Volatility. This state will be referred to as “Moving Exhaustion Zones”
...price range is GREATER than predicted Period Volatility. An example would be, a market has experienced a shock leading to a huge price change and exceeding the Period Volatility. This state will be referred to as “Locked Exhaustion Zones”
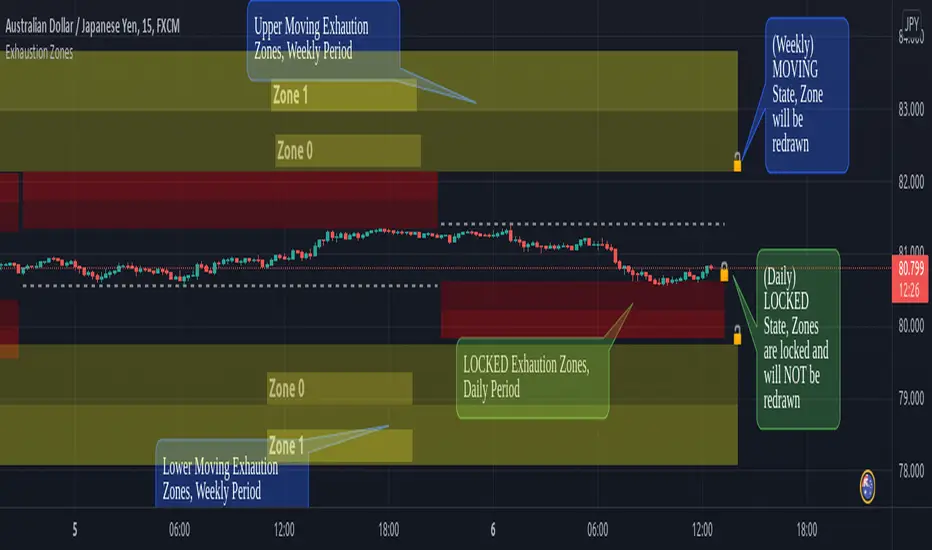
What do the Boxes mean:
Our Indicator displays 2 different Periods - Daily and Weekly. The Daily period is displayed with a red accent color, whereas a weekly Period has a yellow accent.
The Boxes themself display the “Exhaustion Zones”. Each period displays upto 4 Exhaustion Zones - 2 Upper Exhaustion Zones, 2 Lower Exhaustion Zones, each having a “Zone 0” and “Zone 1”.
Moving Exhaustion Zones
Moving Exhaustion Zones displays 4 Exhaustion Zones. These Zones are based on the Period High/Low and are NOT locked, and can still be redrawn. As prices make new Period Highes and Lows, exhaustion Zones will be adjusted. This state is visualized by the Open Lock on the right side of the current Exhaustion Zone.
Locked Exhaustion Zones
Locked Exhaustion Zones display 2 Exhaustion Zones and a dashed Line. Price has made its move and has exceeded predicted Period Volatility. Exhaustion Zones are locked and will NOT be repainted from now on. This state is visualized by the closed Lock on the right side of the current Exhaustion Zone.
How to use it:
The Exhaustion Zones indicator is a mean reverting Indicator. That being said, when Price approaches/enters a Zone, the assumption is that Price will either slow down, or reverse.
The Exhaustion Zone is displayed as 2 Sub-Zones: Zone 0 and Zone 1. As Price continues through the Zones without a reversal, the potential for a reversal increases.
We recommend using this Indicator with a reversal Trading Strategy familiar to you.
Furthermore, this Indicator is well suited as a Target. You can use the Exhaustion Zones to define your Target or where you would like to remove partial Profits.
Important
Please note, that the indicator itself just presents price areas where there is a potential for a price reversal, and that these Zones should not be traded blindly
Time frame:
This indicator is programmed to be used on all Timeframes lower than Weekly Timeframes.
Instruments:
This indicator aims to visualize areas of where Market price has the potential to reverse, hence making this a mean reverting Indicator.
Taking this statement to account, it is recommended to apply this Indicator to Instruments with a mean reverting character.
Examples of mean reverting markets could be for example …
...all FOREX instruments, as FOREX is considered a mean reverting Market.
...an instrument that is in a consolidation, or which you are expecting to enter a period of consolidation.
Indicator settings and configuration:
The Indicator has no functional parameters, to reduce User error, and only has visual parameters. The color of the Zones can be tailored to your liking.
Furthermore you have decided what you would like to display on your chart:
… Display Weekly Zones
...Display Daily Zones
...Show History
...Show Zone States.
Brief concept of Volatility:
Volatility is a concept that has been around for a very long time. Following links are helpful to get a grasp of the concept:
https://en.wikipedia.org/wiki/Volatility_(finance)
https://www.investopedia.com/terms/v/volatility.asp
Our Team:
We are a team of 3 Traders with a combined experience of 40 years. We are using our experiences from the market to create Indicators to Visualize the most relevant Patterns to us in our trading today. Our goal is to reconstruct these patterns to match our understanding of the market and to simplify the process of creating reproducible trading Strategies.
Skrip jemputan sahaja
Hanya pengguna yang diberikan kebenaran oleh penulis mempunyai akses kepada skrip ini dan ini selalunya memerlukan pembayaran. Anda boleh menambahkan skrip kepada kegemaran anda tetapi anda hanya boleh menggunakannya selepas meminta kebenaran dan mendapatkannya daripada penulis — ketarhui lebih lanjut di sini. Untuk lebih butiran, ikuti arahan penulis di bawah atau hubungi account_closed secara terus.
TradingView tidak menyarankan pembayaran untuk atau menggunakan skrip kecuali anda benar-benar mempercayai penulisnya dan memahami bagaimana ia berfungsi. Anda juga boleh mendapatkan alternatif sumber terbuka lain yang percuma dalam skrip komuniti kami.
Arahan penulis
Amaran: sila baca panduan kami untuk skrip jemputan sahaja sebelum memohon akses.
Penafian
Skrip jemputan sahaja
Hanya pengguna yang diberikan kebenaran oleh penulis mempunyai akses kepada skrip ini dan ini selalunya memerlukan pembayaran. Anda boleh menambahkan skrip kepada kegemaran anda tetapi anda hanya boleh menggunakannya selepas meminta kebenaran dan mendapatkannya daripada penulis — ketarhui lebih lanjut di sini. Untuk lebih butiran, ikuti arahan penulis di bawah atau hubungi account_closed secara terus.
TradingView tidak menyarankan pembayaran untuk atau menggunakan skrip kecuali anda benar-benar mempercayai penulisnya dan memahami bagaimana ia berfungsi. Anda juga boleh mendapatkan alternatif sumber terbuka lain yang percuma dalam skrip komuniti kami.
Arahan penulis
Amaran: sila baca panduan kami untuk skrip jemputan sahaja sebelum memohon akses.