OPEN-SOURCE SCRIPT
Telah dikemas kini Pivot Points with MID Levels

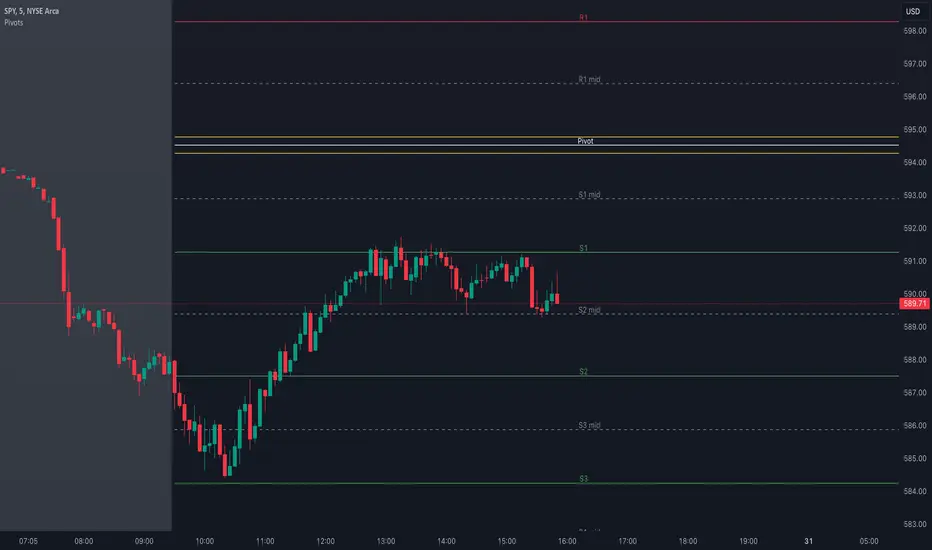
This indicator shows the Standard Pivot Points level based on daily values that can act as support and resistance. It is used by a variety of traders around the world. You can select which time frame Pivot Point Levels you'd like. Daily, weekly etc... Perfect for swing trading or day trading.
Pivot Points- Shows 3 levels of resistance, the Pivot Point and 3 levels of support
(R3, R2, R1, PIVOT POINT, S1, S2, S3
MID Levels- The MID levels are 50% retracement from the pivot point level above it and below
Example- R3, MID, R2, MID, R1, MID, PIVOT POINT, MID, S1, MID, S2, MID, S3
With this indicator you will also have the option to show the Previous days High and Low that are also important levels. On gap up/down days it is always interesting to see if price will close the gap, hence the important level to note.
PDH= Previous Days High
PDL= Previous Days Low
I have added a feature that you can now select specific color to each level and the line style for each level to help understand which levels are being show by personal needs.
Happy Trading
Nota Keluaran
This indicator shows the Standard Pivot Points level based on daily values that can act as support and resistance. It is used by a variety of traders around the world. You can select which time frame Pivot Point Levels you'd like. Daily, weekly etc... Perfect for swing trading or day trading.Pivot Points- Shows 3 levels of resistance, the Pivot Point and 3 levels of support
(R3, R2, R1, PIVOT POINT, S1, S2, S3
MID Levels- The MID levels are 50% retracement from the pivot point level above it and below
Example- R3, MID, R2, MID, R1, MID, PIVOT POINT, MID, S1, MID, S2, MID, S3
With this indicator you will also have the option to show the Previous days High and Low that are also important levels. On gap up/down days it is always interesting to see if price will close the gap, hence the important level to note.
PDH= Previous Days High
PDL= Previous Days Low
I have added a feature that you can now select specific color to each level and the line style for each level to help understand which levels are being show by personal needs.
UPDATE:
Added option to choose line thickness.
For those of you that would like to have 2 sets of Pivot Points such as one for the Daily Levels and the other for the Weekly Levels it will make it easier to see which level is what... As the example shows the Daily pivot Points can be set to "1" thickness and the weekly can be set with "4" thickness...
Happy Trading
Nota Keluaran
Added R4mid, R4, R5mid, R5 and S4mid, S4, S5mid, S5Also Removed PDH/PDL
Nota Keluaran
Added Central Pivot Range "CPR"Labels on chart shows as follow
TC = Top Central
BC = Bottom Central
NOTE !!!
if not desired please go to the colors option and bring it down to 0%
Nota Keluaran
added 2 exponential moving averages and some color changes to Pivot pointsNota Keluaran
Minior bug fixNota Keluaran
minor bug fixNota Keluaran
Added moving averages with option to opt outadded VWAP that hides on a Daily chart and option to opt out
added Heiken Ashi Candle Overlay so it doesn't skew with the pivot point data for those who would like to use it in conjunction.
PS. go to chart settings > Symbol> and uncheck the candles colors. this way you wont have 2 sets of candles showing
Nota Keluaran
minor bug fixNota Keluaran
Wanted to keep this indicator as simple as possible, i've created another indicator with the previous additions as a separate entity, this is for traders who are looking for pivot points solely.Nota Keluaran
fixed an errorNota Keluaran
added CPR by requestNota Keluaran
Updated to V6 Nota Keluaran
minor update Skrip sumber terbuka
Dalam semangat TradingView sebenar, pencipta skrip ini telah menjadikannya sumber terbuka, jadi pedagang boleh menilai dan mengesahkan kefungsiannya. Terima kasih kepada penulis! Walaupuan anda boleh menggunakan secara percuma, ingat bahawa penerbitan semula kod ini tertakluk kepada Peraturan Dalaman.
Penafian
Maklumat dan penerbitan adalah tidak bertujuan, dan tidak membentuk, nasihat atau cadangan kewangan, pelaburan, dagangan atau jenis lain yang diberikan atau disahkan oleh TradingView. Baca lebih dalam Terma Penggunaan.
Skrip sumber terbuka
Dalam semangat TradingView sebenar, pencipta skrip ini telah menjadikannya sumber terbuka, jadi pedagang boleh menilai dan mengesahkan kefungsiannya. Terima kasih kepada penulis! Walaupuan anda boleh menggunakan secara percuma, ingat bahawa penerbitan semula kod ini tertakluk kepada Peraturan Dalaman.
Penafian
Maklumat dan penerbitan adalah tidak bertujuan, dan tidak membentuk, nasihat atau cadangan kewangan, pelaburan, dagangan atau jenis lain yang diberikan atau disahkan oleh TradingView. Baca lebih dalam Terma Penggunaan.