OPEN-SOURCE SCRIPT
CheckmateTrades - Pivots End Game
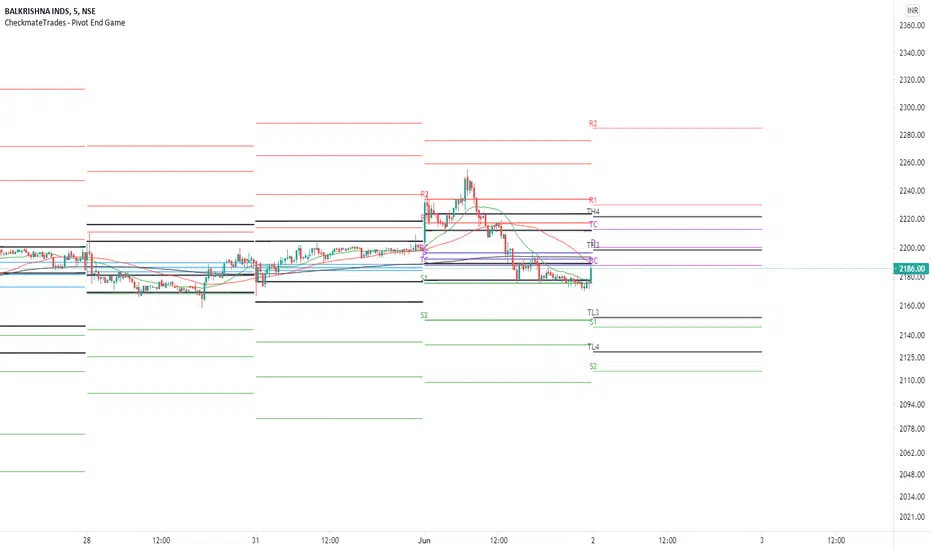
This indicator is based on the Pivot study. Traders will be able to plot CPR, Standard floor pivots as well as Camarilla Pivots on multiple timeframes.
Why pivots from multiple timeframes are relevant and included in this one indicator?
We can analyse pivots on multiple timeframes for different trading setups. As in, Daily floor pivots are best suited for analysing the market trend for Day trading. Similarly, Weekly and Monthly floor pivots can be analysed for Swing and positional trading entries. Whereas yearly pivot is best suited for trend analysis for investment purpose.
What is the relevance of plotting tomorrow's pivot level in advance?
Pivot are calculated based on the price happened on a previous day. And hence trader can plot tomorrow pivots in advance to shortlist stocks for tomorrow's trading session.
TimeFrames Available to traders are –
1. Daily
2. Weekly
3. Monthly
A) Daily Pivots
Present Day –
1. Trader can plot Daily CPR
2. Trader can plot Daily R1, R2, R3 and R4 pivot resistance levels
3. Trader can plot Daily S1, S2, S3 and S4 pivot support levels
4. Trader can plot Daily Camarilla levels
Future Day –
1. Trader can plot Tomorrow CPR
2. Trader can plot Tomorrow R1, R2, R3 and R4 pivot resistance levels
3. Trader can plot Tomorrow S1, S2, S3 and S4 pivot support levels
4. Trader can plot Tomorrow Camarilla levels
5. Previous Day High and Low
B) Weekly Pivots
Present Week –
1. Trader can plot Present week CPR
2. Trader can plot Present week R1, R2, R3 and R4 pivot resistance levels
3. Trader can plot Present week S1, S2, S3 and S4 pivot support levels
4. Trader can plot Present week Camarilla levels
Next Week –
1. Trader can plot Next week CPR
2. Trader can plot Next week R1, R2, R3 and R4 pivot resistance levels
3. Trader can plot Next week S1, S2, S3 and S4 pivot support levels
4. Trader can plot Next week Camarilla levels
5. Previous Week High and Low
C) Monthly Pivots
Present Month –
1. Trader can plot Present Month CPR
2. Trader can plot Present Month R1, R2, R3 and R4 pivot resistance levels
3. Trader can plot Present Month S1, S2, S3 and S4 pivot support levels
4. Trader can plot Present Month Camarilla levels
Next Month –
1. Trader can plot Next Month CPR
2. Trader can plot Next Month R1, R2, R3 and R4 pivot resistance levels
3. Trader can plot Next Month S1, S2, S3 and S4 pivot support levels
4. Trader can plot Next Month Camarilla levels
5. Previous Month High and Low
Moreover, I have also included SMA (Simple moving averages) study in this indicator. Trader can add 20,50 & 200 SMA on there charts.
Why is it relevant? Trader can get a visual confirmation of an up-trending or an down-trending move by looking at rising or falling 20 & 50 SMA respectively
Usually in an uptrending stocks. 20 & 50 SMA will move in parallel to each other and will rise upwards. Price will tend to trade above the 20 SMA and 20 SMA will continue to act as a support.
Skrip sumber terbuka
Dalam semangat sebenar TradingView, pencipta skrip ini telah menjadikannya sumber terbuka supaya pedagang dapat menilai dan mengesahkan kefungsiannya. Terima kasih kepada penulis! Walaupun anda boleh menggunakannya secara percuma, ingat bahawa menerbitkan semula kod ini adalah tertakluk kepada Peraturan Dalaman kami.
Penafian
Maklumat dan penerbitan adalah tidak dimaksudkan untuk menjadi, dan tidak membentuk, nasihat untuk kewangan, pelaburan, perdagangan dan jenis-jenis lain atau cadangan yang dibekalkan atau disahkan oleh TradingView. Baca dengan lebih lanjut di Terma Penggunaan.