OPEN-SOURCE SCRIPT
Momentum Bands
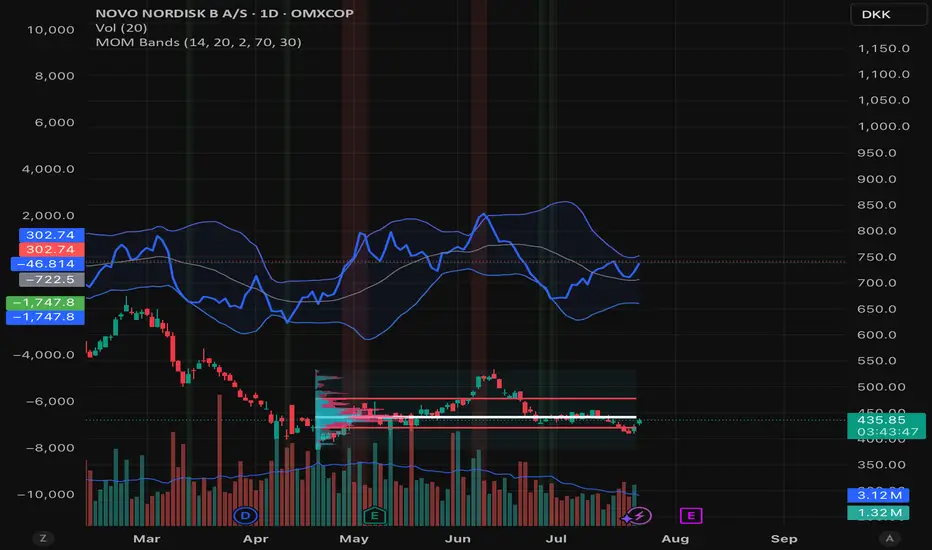
Momentum Bands indicator-->technical tool that measures the rate of price change and surrounds this momentum with adaptive bands to highlight overbought and oversold zones. Unlike Bollinger Bands, which track price, these bands track momentum itself, offering a unique view of market strength and exhaustion points. At its core, it features a blue momentum line that calculates the rate of change over a set period, an upper red band marking dynamic resistance created by adding standard deviations to the momentum average, a lower green band marking dynamic support by subtracting standard deviations, and a gray middle line representing the average of momentum as a central anchor. When the momentum line touches or moves beyond the upper red band, it often signals that the market may be overbought and a pullback or reversal could follow; traders might lock in profits or watch for short setups. Conversely, when it drops below the lower green band, it can suggest an oversold market primed for a bounce, prompting traders to look for buying opportunities. If momentum remains between the bands, it typically indicates balanced conditions where waiting for stronger signals at the extremes is wise. The indicator can be used in contrarian strategies—buying near the lower band and selling near the upper—or in trend-following setups by waiting for momentum to return toward the centerline before entering trades. For stronger confirmation, traders often combine it with volume spikes, support and resistance analysis, or other trend tools, and it’s useful to check multiple timeframes to spot consistent patterns. Recommended settings vary: short-term traders might use a 7–10 period momentum with 14-period bands; medium-term traders might keep the default 14-period momentum and 20-period bands; while long-term analysis might use 21-period momentum and 50-period bands. Visually, background colors help spot extremes: red for strong overbought, green for strong oversold, and no color for normal markets, alongside reference lines at 70, 30, and 0 to guide traditional overbought, oversold, and neutral zones. Typical bullish signals include momentum rebounding from the lower band, crossing back above the middle after being oversold, or showing divergence where price makes new lows but momentum doesn’t. Bearish signals might appear when momentum hits the upper band and weakens, drops below the middle after being overbought, or price makes new highs while momentum fails to follow. The indicator tends to work best in mean-reverting or sideways markets rather than strong trends, where overbought and oversold conditions tend to repeat.
Skrip sumber terbuka
Dalam semangat TradingView sebenar, pencipta skrip ini telah menjadikannya sumber terbuka, jadi pedagang boleh menilai dan mengesahkan kefungsiannya. Terima kasih kepada penulis! Walaupuan anda boleh menggunakan secara percuma, ingat bahawa penerbitan semula kod ini tertakluk kepada Peraturan Dalaman.
Penafian
Maklumat dan penerbitan adalah tidak bertujuan, dan tidak membentuk, nasihat atau cadangan kewangan, pelaburan, dagangan atau jenis lain yang diberikan atau disahkan oleh TradingView. Baca lebih dalam Terma Penggunaan.