OPEN-SOURCE SCRIPT
Wick Strategy Analyzer
Overview
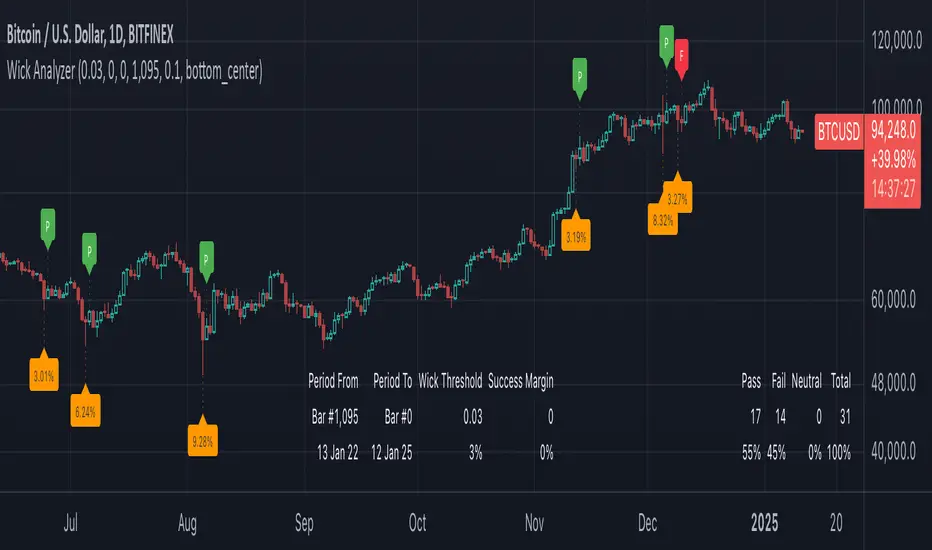
This indicator analyzes candle wick patterns and evaluates their outcomes over a user-definable range (default is 1 year). Labels are rendered on the chart to mark events that meet the specified wick condition.
Features
Customizable Bar Range - users can specify the range of bars to include in the analysis. Default is 365 bars back from the most recent bar (bar 0)
Visual Indicators - labels are rendered to mark conditions & outcomes.
Input Parameters
Example Scenario
Goal: Analyze how candles with a wick size of at least 3.5% perform within a success margin of 1% over the past 540 days.
Setup:
Expected Output
This indicator analyzes candle wick patterns and evaluates their outcomes over a user-definable range (default is 1 year). Labels are rendered on the chart to mark events that meet the specified wick condition.
Features
Customizable Bar Range - users can specify the range of bars to include in the analysis. Default is 365 bars back from the most recent bar (bar 0)
Visual Indicators - labels are rendered to mark conditions & outcomes.
- Wick Condition Met - an Orange label below the wick candle displaying the wick’s percentage size.
- Outcome Labels - rendered above the candle after wick condition met candles
- P (Green): Pass
- F (Red): Fail
- N (Navy): Neutral
- I (Blue): Indicates the current candle has not yet closed, so the outcome is undetermined.
- P (Green): Pass
Input Parameters
- Wick Threshold [default 0.05 (5%), range 0.0 to 1.0] - minimum wick size required to qualify as a wick condition.
- Success Margin [default 0.0, range 0.0 to 1.0)] - Defines the margin for classifying outcomes as Pass, Fail, or Neutral. E.g., a success margin of 0.01 requires the next candle's close to exceed the wick candle's close by 1% in order to be a Pass.
- Bar Offset Start [default 0] - starting offset from the last bar for analysis. A value of -1 will include all bars.
- Bar Offset End [default 365] - ending offset from the last bar for analysis. Bars outside this range are excluded.
Example Scenario
Goal: Analyze how candles with a wick size of at least 3.5% perform within a success margin of 1% over the past 540 days.
Setup:
- Set Wick Threshold to 0.035
- Set Success Margin to 0.01
- Set Bar Range Start to 0
- Set Bar Range End to 540.
Expected Output
- Candles with a wick of at least 3.5% are labeled.
- Outcome labels (P, F, or N) indicate performance.
Skrip sumber terbuka
Dalam semangat TradingView sebenar, pencipta skrip ini telah menjadikannya sumber terbuka, jadi pedagang boleh menilai dan mengesahkan kefungsiannya. Terima kasih kepada penulis! Walaupuan anda boleh menggunakan secara percuma, ingat bahawa penerbitan semula kod ini tertakluk kepada Peraturan Dalaman.
Penafian
Maklumat dan penerbitan adalah tidak bertujuan, dan tidak membentuk, nasihat atau cadangan kewangan, pelaburan, dagangan atau jenis lain yang diberikan atau disahkan oleh TradingView. Baca lebih dalam Terma Penggunaan.