PROTECTED SOURCE SCRIPT
TradersAID / Adaptive Smoothing Channel (use on 1W chart)
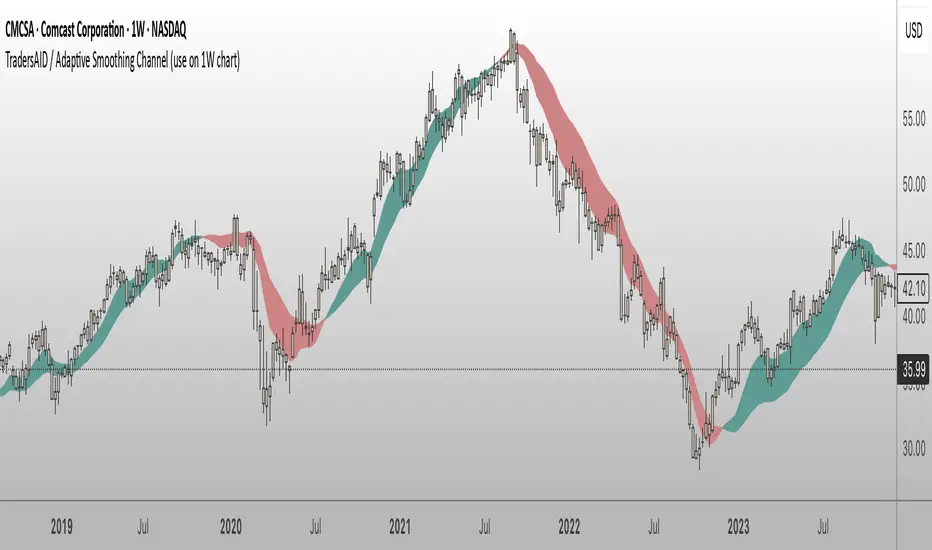
TradersAID – Adaptive Smoothing Channel (use on 1-Week chart)
Overview
TradersAID – Adaptive Smoothing Channel is a two-line price overlay designed to help traders interpret trend structure and shifting momentum zones on the 1-week chart only.
Unlike traditional moving averages or fixed smoothing methods, this tool uses an adaptive approach inspired by Kalman filtering — a concept widely used in robotics and control systems to track signals in noisy environments. Applied to price, this allows the band to adapt to directional flow and volatility while filtering out distracting short-term fluctuations.
1.What It Does
This tool builds a dynamic corridor around price using:
• A faster line that follows near-term directional movement
• A slower line that anchors broader market structure
Together, they form a responsive band that:
• Tilts with trend direction (via slope)
• Expands or contracts with volatility
• Fills the space between to show directional rhythm
It’s especially useful for observing how price moves within sustained trends or compression zones, helping traders visually interpret market structure with more clarity.
2. How to Use It
• Trend Structure:
Follow the slope of the band to understand overall direction. A narrowing band may indicate consolidation; a widening band may reflect strong follow-through.
• Momentum Compression Zones:
Watch for tightening distance between the lines — this may signal the market is preparing for a structural transition or breakout.
• Clarity Layer:
Overlay this tool with others (e.g. TradersAID Warning Dots) to reduce noise and improve decision context.
3. Key Features
• Dual Adaptive Lines: One fast, one slow — capturing different time dynamics
• Shaded Fill Zone: Highlights directional bias and rhythm
• 3 Reaction Modes: Slow / Regular / Fast for different sensitivities
• Overlay Style: Plots directly on price
• Minimalist Layout: Clean visual language
4. Technical Basis (Why It’s Closed Source)
This tool is based on a custom smoothing logic inspired by Kalman filtering, adapted specifically for charting market structure.
While it does not replicate a full Kalman system, it borrows key principles: dynamically adjusting to noisy input while maintaining structural clarity.
The algorithm was developed internally to provide a visual layer that integrates into the broader TradersAID analysis system — offering something distinct from public indicators. Its behavior, flexibility, and integration were designed to serve advanced structural analysis, and as such, the script is closed to protect proprietary logic and intellectual property.
5. Settings
• Mode Selector: Fast / Regular / Slow
• Color Fill Toggle & Styling
• Frame Lock:
✅ This script is built to work exclusively on the 1-week timeframe.
6. Disclaimer
This tool is for educational and informational purposes only. It does not offer financial advice or generate trading signals. Always use with your own strategy and discretion.
Skrip dilindungi
Skrip ini diterbitkan sebagai sumber tertutup. Akan tetapi, anda boleh menggunakannya secara bebas dan tanpa apa-apa had – ketahui lebih di sini.
Penafian
Maklumat dan penerbitan adalah tidak bertujuan, dan tidak membentuk, nasihat atau cadangan kewangan, pelaburan, dagangan atau jenis lain yang diberikan atau disahkan oleh TradingView. Baca lebih dalam Terma Penggunaan.