PROTECTED SOURCE SCRIPT
Telah dikemas kini Bubu VWEMA & VWAP

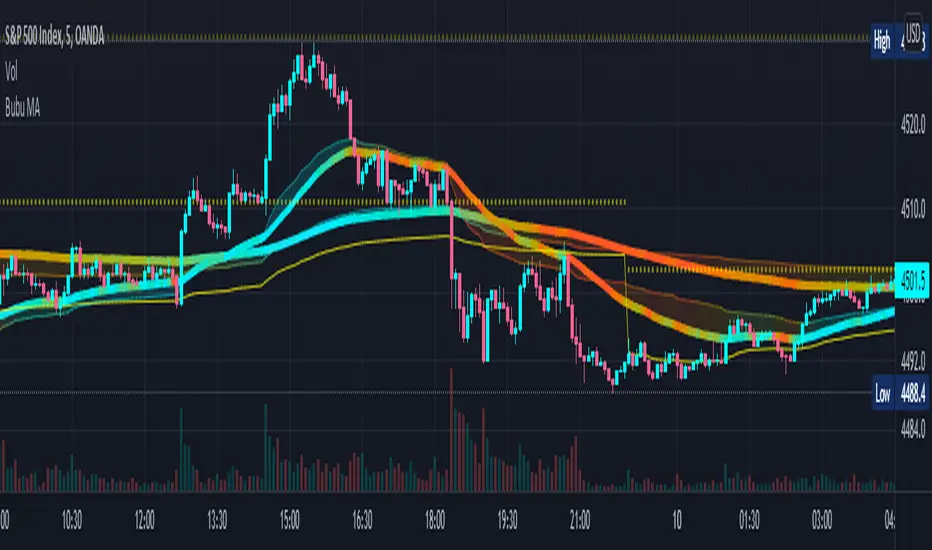
Volume Weighted Exponential Moving Average gives additional support / resistance lines to track as well as giving confidence to there respective EMAs.
A VWEMA will act much faster to volume spikes.
Intraday, Daily, and Weekly VWAPs are also shown to give more support / resistance lines to track.
The normal EMA lines (Thick ones) have colours based on a matrix calculated in the back. The Fast EMA is using 20 RSI indicators tracking how many cross above 50. The slow EMA is using 40 MACDs histograms when they cross mid point.
The VWEMA and the fill is graded on 20(fast) and 40(slow) VWEMAs crossovers.
Nota Keluaran
- Fixed issue with daily & weekly vwap not calculating correctly- Increased transparancy of fill
Nota Keluaran
Update chart shownSkrip dilindungi
Skrip ini diterbitkan sebagai sumber tertutup. Akan tetapi, anda boleh menggunakannya secara bebas dan tanpa apa-apa had – ketahui lebih di sini.
Penafian
Maklumat dan penerbitan adalah tidak bertujuan, dan tidak membentuk, nasihat atau cadangan kewangan, pelaburan, dagangan atau jenis lain yang diberikan atau disahkan oleh TradingView. Baca lebih dalam Terma Penggunaan.
Skrip dilindungi
Skrip ini diterbitkan sebagai sumber tertutup. Akan tetapi, anda boleh menggunakannya secara bebas dan tanpa apa-apa had – ketahui lebih di sini.
Penafian
Maklumat dan penerbitan adalah tidak bertujuan, dan tidak membentuk, nasihat atau cadangan kewangan, pelaburan, dagangan atau jenis lain yang diberikan atau disahkan oleh TradingView. Baca lebih dalam Terma Penggunaan.