PROTECTED SOURCE SCRIPT
Trend Shift Histogram By Clarity Charts
Trend Shift Histogram – A Brand New Formula by Clarity Charts
The Trend Shift Histogram is a brand-new mathematical formula designed to capture market momentum shifts with exceptional clarity.
Unlike traditional histograms, this indicator focuses on detecting early changes in market direction by analyzing underlying trend strength and momentum imbalances.
Key Features:
New Formula – Built from scratch to highlight momentum reversals and hidden trend shifts.
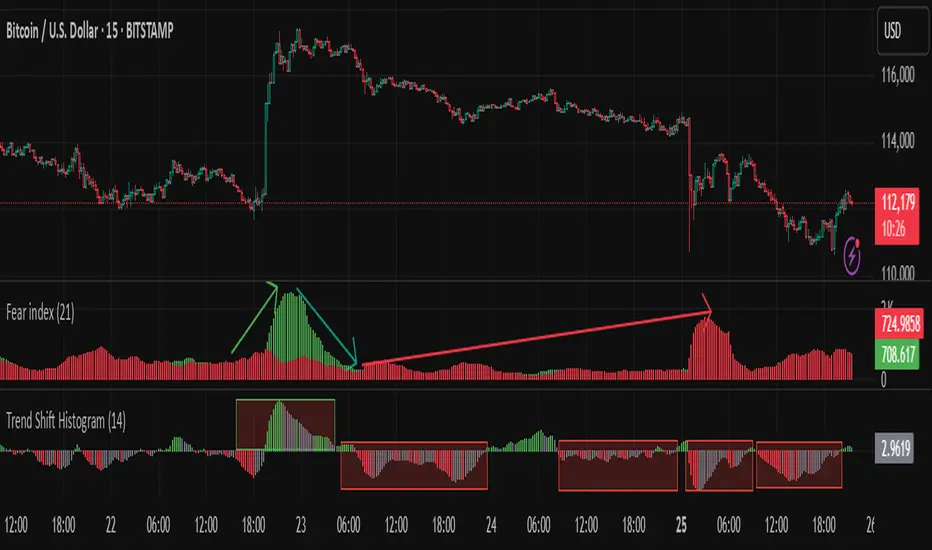
Visual Clarity – Green and red histogram bars make it easy to identify bullish and bearish phases, and grey area as trend reversal or sideways zone.
Trend Detection – Helps traders spot when the market is about to shift direction, often before price reacts strongly.
Scalable Settings –
Use smaller lengths for scalping and short-term trades.
Use larger lengths for swing trading and longer trend analysis.
Every Timeframe Ready – Whether you’re scalping on 1m or analyzing weekly charts, the histogram adapts seamlessly.
Power of Combining with the Fear Index
The Trend Shift Histogram becomes even more powerful when combined with Fear Index by Clarity Charts :
Fear Index by Clarity Charts
Together:
Fear Index highlights market fear & exhaustion levels, showing when traders are capitulating.
Trend Shift Histogram confirms the direction of the new trend once fear has peaked.
How to Use:
📈 Long Entry Condition
A long position is triggered when the following conditions align:
The Fear Index Bulls are showing upward momentum, indicating strengthening bullish sentiment.
The Fear Index Bears are simultaneously declining, signaling weakening bearish pressure.
The Trend Shift Histogram transitions from a short bias to a long bias, confirming a structural shift in market direction.
When all three conditions occur together, it provides a strong confluence to initiate a long trade entry.
📉 Short Entry Condition
A short position is triggered when the opposite conditions align:
The Fear Index Bears are showing upward momentum, indicating strengthening bearish sentiment.
The Fear Index Bulls are simultaneously declining, signaling weakening bullish pressure.
The Trend Shift Histogram transitions from a long bias to a short bias, confirming a structural shift in market direction.
When all three conditions occur together, it provides a strong confluence to initiate a short trade entry.
🔄 Bullish Trend Cycle
During a bullish phase as per the Fear Index, you can capture the entire cycle by:
Entry: Taking entries when the Trend Shift Histogram begins printing green bars, which mark the start of a bullish trend shift.
Exit: Closing the position when the histogram transitions to grey bars, signaling exhaustion or a potential pause in the bullish cycle.
This approach allows you to ride the bullish momentum effectively while respecting market cycle shifts.
🔻 Bearish Trend Cycle
During a bearish phase as per the Fear Index, you can capture the entire cycle by:
Entry: Taking entries when the Trend Shift Histogram begins printing red bars, which mark the start of a bearish trend shift.
Exit: Closing the position when the histogram transitions to grey bars, signaling exhaustion or a potential pause in the bearish cycle.
This approach ensures that bearish trends are traded with precision, avoiding late entries and capturing maximum move potential.
Watch for histogram color changes (green = bullish, red = bearish, grey = sideways).
Adjust length settings based on your style:
Small = intraday & scalping precision.
Large = swing & positional confidence.
Combine signals with Fear Index peaks for high-probability reversal zones.
Apply across any timeframe for flexible strategy building.
Who Can Use This
Scalpers – Catch quick intraday shifts.
Swing Traders – Ride bigger moves with confidence.
Long-Term Investors – Spot early warning signs of market trend reversals.
Contact & Support
For collaboration, premium indicators, or custom strategy building:
theclaritycharts@gmail.com
The Trend Shift Histogram is a brand-new mathematical formula designed to capture market momentum shifts with exceptional clarity.
Unlike traditional histograms, this indicator focuses on detecting early changes in market direction by analyzing underlying trend strength and momentum imbalances.
Key Features:
New Formula – Built from scratch to highlight momentum reversals and hidden trend shifts.
Visual Clarity – Green and red histogram bars make it easy to identify bullish and bearish phases, and grey area as trend reversal or sideways zone.
Trend Detection – Helps traders spot when the market is about to shift direction, often before price reacts strongly.
Scalable Settings –
Use smaller lengths for scalping and short-term trades.
Use larger lengths for swing trading and longer trend analysis.
Every Timeframe Ready – Whether you’re scalping on 1m or analyzing weekly charts, the histogram adapts seamlessly.
Power of Combining with the Fear Index
The Trend Shift Histogram becomes even more powerful when combined with Fear Index by Clarity Charts :
Fear Index by Clarity Charts
Together:
Fear Index highlights market fear & exhaustion levels, showing when traders are capitulating.
Trend Shift Histogram confirms the direction of the new trend once fear has peaked.
How to Use:
📈 Long Entry Condition
A long position is triggered when the following conditions align:
The Fear Index Bulls are showing upward momentum, indicating strengthening bullish sentiment.
The Fear Index Bears are simultaneously declining, signaling weakening bearish pressure.
The Trend Shift Histogram transitions from a short bias to a long bias, confirming a structural shift in market direction.
When all three conditions occur together, it provides a strong confluence to initiate a long trade entry.
📉 Short Entry Condition
A short position is triggered when the opposite conditions align:
The Fear Index Bears are showing upward momentum, indicating strengthening bearish sentiment.
The Fear Index Bulls are simultaneously declining, signaling weakening bullish pressure.
The Trend Shift Histogram transitions from a long bias to a short bias, confirming a structural shift in market direction.
When all three conditions occur together, it provides a strong confluence to initiate a short trade entry.
🔄 Bullish Trend Cycle
During a bullish phase as per the Fear Index, you can capture the entire cycle by:
Entry: Taking entries when the Trend Shift Histogram begins printing green bars, which mark the start of a bullish trend shift.
Exit: Closing the position when the histogram transitions to grey bars, signaling exhaustion or a potential pause in the bullish cycle.
This approach allows you to ride the bullish momentum effectively while respecting market cycle shifts.
🔻 Bearish Trend Cycle
During a bearish phase as per the Fear Index, you can capture the entire cycle by:
Entry: Taking entries when the Trend Shift Histogram begins printing red bars, which mark the start of a bearish trend shift.
Exit: Closing the position when the histogram transitions to grey bars, signaling exhaustion or a potential pause in the bearish cycle.
This approach ensures that bearish trends are traded with precision, avoiding late entries and capturing maximum move potential.
Watch for histogram color changes (green = bullish, red = bearish, grey = sideways).
Adjust length settings based on your style:
Small = intraday & scalping precision.
Large = swing & positional confidence.
Combine signals with Fear Index peaks for high-probability reversal zones.
Apply across any timeframe for flexible strategy building.
Who Can Use This
Scalpers – Catch quick intraday shifts.
Swing Traders – Ride bigger moves with confidence.
Long-Term Investors – Spot early warning signs of market trend reversals.
Contact & Support
For collaboration, premium indicators, or custom strategy building:
theclaritycharts@gmail.com
Skrip dilindungi
Skrip ini diterbitkan sebagai sumber tertutup. Akan tetapi, anda boleh menggunakannya dengan percuma dan tanpa had – ketahui lebih lanjut di sini.
Penafian
Maklumat dan penerbitan adalah tidak dimaksudkan untuk menjadi, dan tidak membentuk, nasihat untuk kewangan, pelaburan, perdagangan dan jenis-jenis lain atau cadangan yang dibekalkan atau disahkan oleh TradingView. Baca dengan lebih lanjut di Terma Penggunaan.