PROTECTED SOURCE SCRIPT
Gemini All-in-One
Description
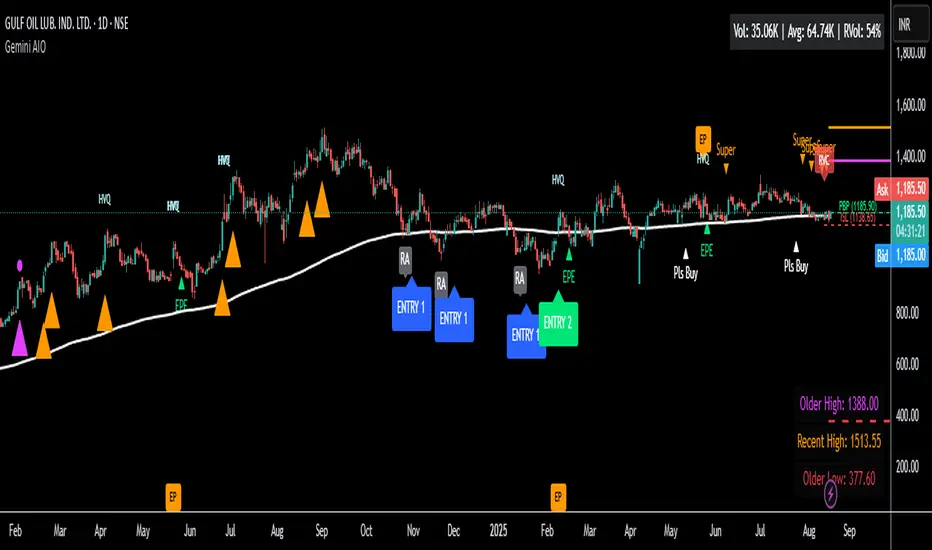
The Gemini AIO (All-in-One) is a comprehensive overlay indicator designed for swing and position traders. It merges three distinct and powerful trading strategies into a single, cohesive tool to identify high-probability setups in stocks that are in confirmed uptrends.
What the Indicator Does:
Combines Three Strategies: Integrates a multi-scanner breakout system, a mean-reversion model, and a multi-year breakout tool into one indicator.
Main Modules
Signals Module:
1. Features six unique scanner signals (CS1-CS6) to identify a variety of bullish consolidation patterns.
2. Includes a full trade management framework with RVC (Red Volume Candle), PBP (Post Breakout Pivot Entry), and ISL (Initial Stop Loss) levels.
3. Identifies powerful Episodic Pivot (EP) and EP Entry (EPE) signals for stocks showing exceptional strength.
Reversal Module:
1. A mean-reversion strategy that primarily uses Bollinger Bands to find oversold conditions.
2. Provides a three-stage signal process: RA (Reversal Setup), Entry 1, and Entry 2 to time entries from a potential bottom.
Multi-Year Breakout (MYBO) Module:
1. Automatically identifies and plots historical, multi-year resistance and support levels.
2. Generates a clear signal when the price breaks out above these significant long-term levels.
Advanced Alerts: Features a highly customizable alert system that can be timed to trigger either on the bar's close or at a specific time of day (e.g., 2:30 PM IST), allowing for end-of-day style notifications.
How to Best Use It:
This indicator is most powerful when used with a systematic, rules-based approach. The core principle is to use long-term moving averages to define the trend and then use the indicator's signals to time entries within that trend.
The Foundation (Trend Filter): The most important rule is to only consider long setups on stocks where the 150-day SMA is above the 200-day EMA, and the 150-day SMA is sloping upwards. This keeps you aligned with the primary uptrend.
Strategy 1: The Momentum Breakout (PBP Entry)
1. Confirm the stock meets the primary trend filter rules.
2. Wait for an AIO setup signal (Super, Pls Buy, etc.) to draw a PBP line.
3. Enter when the price crosses above the PBP line or wait for a pull back after the price has crossed the PBP line.
Strategy 2: The Mean Reversion (RA Entry)
1. Confirm the stock meets the primary trend filter rules.
2. Wait for an "RA" (Reversal Setup) signal to appear on the chart.
3. Enter on the "ENTRY 1" (Risky Entry) or "ENTRY 2" signal (Safer Entry) or wait for a pull back after "ENTRY 1" or "ENTRY 2" signal.
Strategy 3: Multi-Year Breakout (MYBO) :
1. A breakout triangle (orange or fuchsia) appears below the candle, signaling a close above the "Recent High" (Orange) or "Older High" (Fuchsia).
2. Recent High refers to the highest price the stock has reached in last 12 months. Breaking above the "Recent High" is a sign of strong current demand.
3. Older High refers to the highest price the stock reached in a more distant, historical period - the period between 5 years ago and 1 year ago. Breaking above the "Older High" is a sign of VERY strong demand as it has broken a historic high.
4. Wait for a breakout triangle to appear on the chart.
5. Enter on the high of the candle marked with a breakout triangle or wait for a pull back after that signal.
Customize Your View: Use the "Inputs" tab to enable/disable the modules you want to focus on and configure the alerts you want to receive. Use the "Style" tab to hide any visual elements you don't need to keep your chart clean.
Skrip dilindungi
Skrip ini diterbitkan sebagai sumber tertutup. Akan tetapi, anda boleh menggunakannya secara bebas dan tanpa apa-apa had – ketahui lebih di sini.
Penafian
Maklumat dan penerbitan adalah tidak bertujuan, dan tidak membentuk, nasihat atau cadangan kewangan, pelaburan, dagangan atau jenis lain yang diberikan atau disahkan oleh TradingView. Baca lebih dalam Terma Penggunaan.