Manipulation/Distribution[cem_trades]
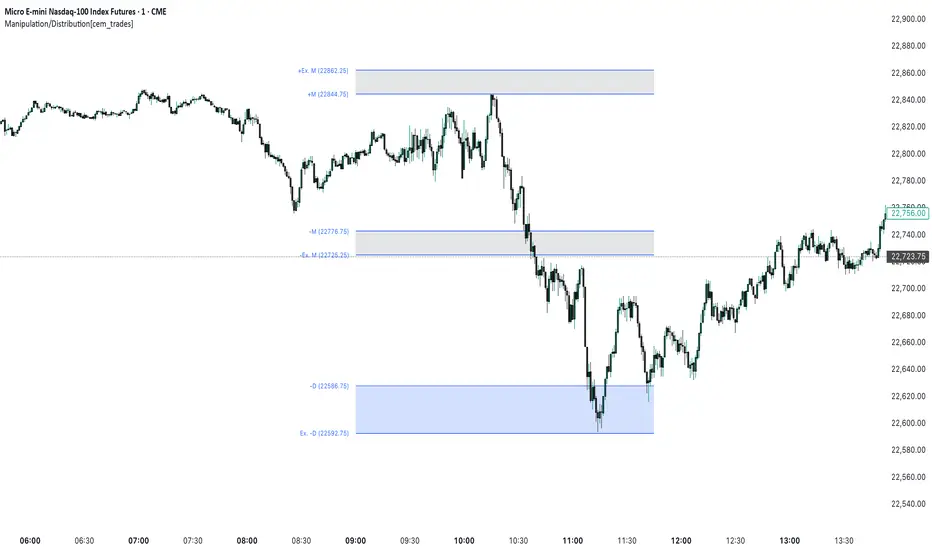
- Bearish Manipulation Zone (-M to -Ex. M)
- Bullish Distribution Zone (+D to +Ex. D)
- Bullish Manipulation Zone (+M to +Ex. M)
- Bearish Distribution Zone (-D to -Ex. D)
The manipulation zones (M) are located closer to the current price and represent areas where stop hunts or false breakouts are statistically more likely. If price enters and reacts within one of these zones, the opposite distribution zone (D) becomes a potential target.
The Extended (Ex.) levels visualize the wider boundary for each zone based on historical expansion data, helping traders frame directional bias and risk levels.
This indicator is particularly useful for:
- Detecting possible liquidity grabs
- Anticipating reversals or continuations after manipulation
- Structuring trades with defined invalidation and target zones
Note: This invite-only script uses a proprietary model for dynamic zone placement and boundary extension logic that is not found in open-source scripts.
Skrip jemputan sahaja
Hanya pengguna yang diluluskan oleh penulis boleh mengakses skrip ini. Anda perlu memohon dan mendapatkan kebenaran untuk menggunakannya. Ini selalunya diberikan selepas pembayaran. Untuk lebih butiran, ikuti arahan penulis di bawah atau hubungi terus cem_trades.
TradingView tidak menyarankan pembayaran untuk atau menggunakan skrip kecuali anda benar-benar mempercayai penulisnya dan memahami bagaimana ia berfungsi. Anda juga boleh mendapatkan alternatif sumber terbuka lain yang percuma dalam skrip komuniti kami.
Arahan penulis
Amaran: sila baca panduan kami untuk skrip jemputan sahaja sebelum memohon akses.
Penafian
Skrip jemputan sahaja
Hanya pengguna yang diluluskan oleh penulis boleh mengakses skrip ini. Anda perlu memohon dan mendapatkan kebenaran untuk menggunakannya. Ini selalunya diberikan selepas pembayaran. Untuk lebih butiran, ikuti arahan penulis di bawah atau hubungi terus cem_trades.
TradingView tidak menyarankan pembayaran untuk atau menggunakan skrip kecuali anda benar-benar mempercayai penulisnya dan memahami bagaimana ia berfungsi. Anda juga boleh mendapatkan alternatif sumber terbuka lain yang percuma dalam skrip komuniti kami.
Arahan penulis
Amaran: sila baca panduan kami untuk skrip jemputan sahaja sebelum memohon akses.