OPEN-SOURCE SCRIPT
Tweezer Patterns
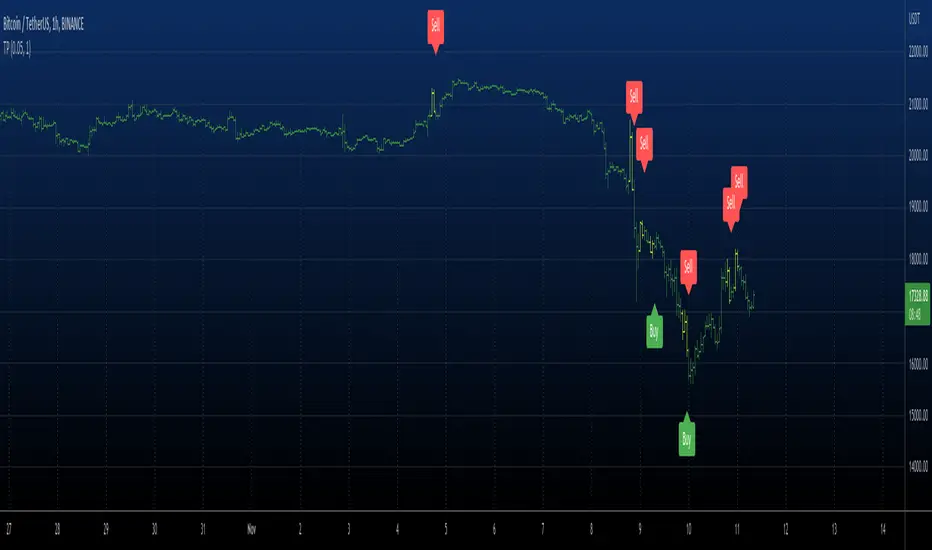
Tweezer top and bottom, also known as tweezers, are reversal candlestick patterns
that signal a potential change in the price direction. Both formations consist of
two candles that occur at the end of a trend, which is in its dying stages.
The tweezer bottom candlestick pattern is a bullish reversal pattern that can be
spotted at the bottom of a downtrend. It consists of two candles, where the first
candle is in line with the bearish trend, while the second candle reflects more
bullish market sentiment as the price bursts higher, in the opposite trend.
The tweezer top candlestick pattern is of the same structure as the tweezer bottom,
except for the fact that it happens at the end of an uptrend, and therefore, it is a
bearish reversal pattern. The first candle is bullish, and it continues in the same
direction, while the second bearish candle indicates that the trend may be changing soon.
Both the bottom and top tweezers are only valid when they occur during uptrends and downtrends.
Their appearance during choppy trading conditions is practically meaningless, and it signals
the market indecision to move in either direction.
WARNING:
- For purpose educate only
- This script to change bars colors.
Skrip sumber terbuka
Dalam semangat TradingView sebenar, pencipta skrip ini telah menjadikannya sumber terbuka, jadi pedagang boleh menilai dan mengesahkan kefungsiannya. Terima kasih kepada penulis! Walaupuan anda boleh menggunakan secara percuma, ingat bahawa penerbitan semula kod ini tertakluk kepada Peraturan Dalaman.
Penafian
Maklumat dan penerbitan adalah tidak bertujuan, dan tidak membentuk, nasihat atau cadangan kewangan, pelaburan, dagangan atau jenis lain yang diberikan atau disahkan oleh TradingView. Baca lebih dalam Terma Penggunaan.