pi RSI Strategy
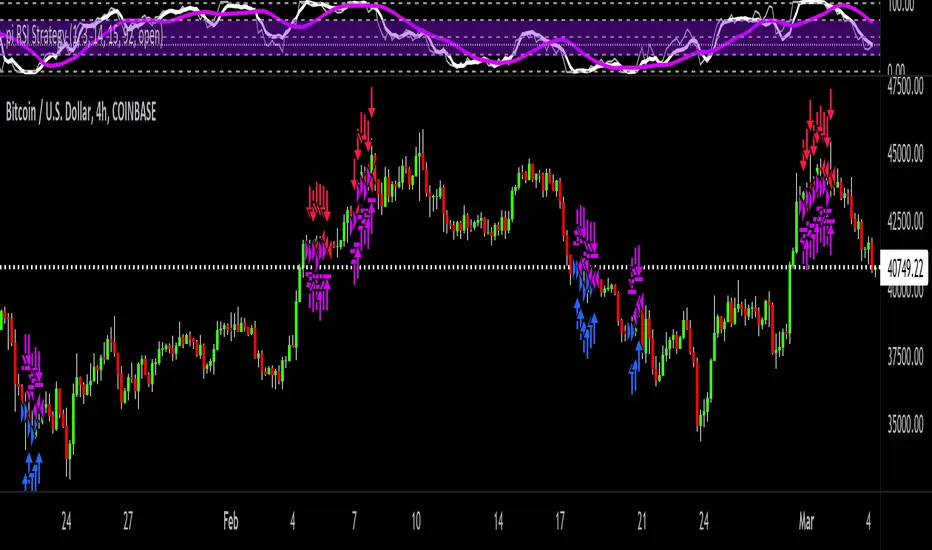
This is a price momentum strategy that helps you evaluate overbought or oversold conditions. By the default colors, when the white line is above the purple it's going bullish. And when the white line is under the purple it's going bearish.
Also, on the scale, 50 is neutral, below 25 is getting oversold and above 75 is getting overbought. This strategy is useful in conjunction with other price and volume indicators / strategies to help redundantly confirm future price action.
I've spent exhaustive effort on new research & development, engineering, back testing accuracy, real time capital testing, & future version revision of my trading indicator / strategy scripts.
Skrip jemputan sahaja
Hanya pengguna disahkan oleh penulis boleh mengakses skrip ini. Anda perlu memohon dan mendapatkan kebenaran untuk menggunakannya. Keizinan selalunya diberikan selepas pembayaran. Untuk lebih butiran, ikuti arahan penulis di bawah atau hubungi Options360 secara terus.
TradingView TIDAK menyarankan pembayaran atau penggunaan skrip kecuali anda mempercayai sepenuhnya penulis dan memahami bagaimana ia berfungsi. Anda juga boleh menjumpai alternatif sumber terbuka dan percuma yang lain di dalam skrip komuniti kami.
Arahan penulis
tradingview.com/u/Options360/
Penafian
Skrip jemputan sahaja
Hanya pengguna disahkan oleh penulis boleh mengakses skrip ini. Anda perlu memohon dan mendapatkan kebenaran untuk menggunakannya. Keizinan selalunya diberikan selepas pembayaran. Untuk lebih butiran, ikuti arahan penulis di bawah atau hubungi Options360 secara terus.
TradingView TIDAK menyarankan pembayaran atau penggunaan skrip kecuali anda mempercayai sepenuhnya penulis dan memahami bagaimana ia berfungsi. Anda juga boleh menjumpai alternatif sumber terbuka dan percuma yang lain di dalam skrip komuniti kami.
Arahan penulis
tradingview.com/u/Options360/