PROTECTED SOURCE SCRIPT
Telah dikemas kini Multiple Timeframe (Moving Average) With Info
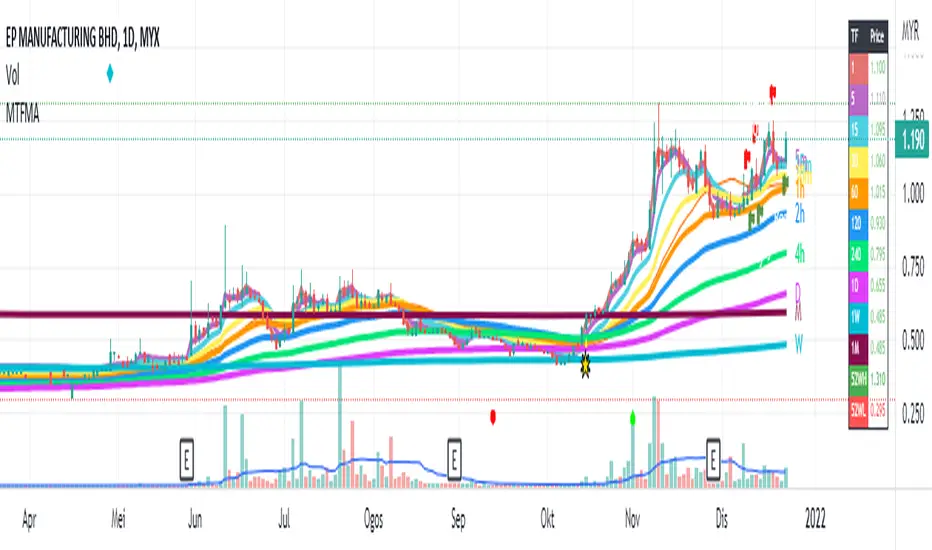
This indicator combine 4 indicator in one pine script : Main indicator is Moving Average in multiple timeframes, Bollinger Band, Crossover Signal, Info Panel, 52Weeks High & 52 Weeks Low.
1)
For multiple moving average, it has 9 difference timeframes.
- Default timeframes is (1minute, 5minutes, 15minutes, 30minutes, 1hour, 4hours, 1Day, 1Week & 1Month). User also have choices to change the option.
- For Moving Average, there also available multiple choice of Moving Average : SMA , EMA , DEMA , VWMA , RMA, WMA . Default Moving Average is EMA (200)
- There also include info panel / table that show TF (Timeframes) for every MAs, & their price. Colors change according to current price. Bullish = Green, Neutral = Neutral, Bearish = Red
There are also function for user to turn on/off :
- (MA) Type & Lenght.
- Multiple MAs.
- Info / Table
User can use multiple line in daily chart to find support & resistance .
Example : For uptrend stock, candle close on top of EMA200 line for 1 hour timeframe. So it's can becomes immediate support, while the other EMAs on below is their next support.
Example :

For downtrend stock, candle close on top of EMA200 line for 5minutes timeframe. So it's become support, while the other EMAs on top is their resistance.
Example :

This Multiple MAs Inspired by xdecow :
tradingview.com/u/xdecow/
Checkout his Multi Timeframe Moving Average here :
![Multi Timeframe Moving Average [xdecow]](https://s3.tradingview.com/i/IzmSs7Ma_mid.png)
2)
This indicator also have Bollingger Band. User have option to turn it on / off. User can use it as a target price if all the EMAs below the candle.
Example :

3)
This indicator also shown 52 Weeks High & 52 Weeks Low. User have option to turn it on / off. Their price also shown at the info panel.
Example :

4)
Crossover Signal. This crossover is default, it happen when candle close on top / near timeframe 5Minutes is (Ready). While candle close below timeframe 5Minutes is (Caution). User can choice other shape if they don't want the text label. To change the crossover for other setup, user can change it under = #2. The crossover only shown in past 10 candle.
Example :

Feel free to use it & comment. Thanks.
1)
For multiple moving average, it has 9 difference timeframes.
- Default timeframes is (1minute, 5minutes, 15minutes, 30minutes, 1hour, 4hours, 1Day, 1Week & 1Month). User also have choices to change the option.
- For Moving Average, there also available multiple choice of Moving Average : SMA , EMA , DEMA , VWMA , RMA, WMA . Default Moving Average is EMA (200)
- There also include info panel / table that show TF (Timeframes) for every MAs, & their price. Colors change according to current price. Bullish = Green, Neutral = Neutral, Bearish = Red
There are also function for user to turn on/off :
- (MA) Type & Lenght.
- Multiple MAs.
- Info / Table
User can use multiple line in daily chart to find support & resistance .
Example : For uptrend stock, candle close on top of EMA200 line for 1 hour timeframe. So it's can becomes immediate support, while the other EMAs on below is their next support.
Example :
For downtrend stock, candle close on top of EMA200 line for 5minutes timeframe. So it's become support, while the other EMAs on top is their resistance.
Example :
This Multiple MAs Inspired by xdecow :
tradingview.com/u/xdecow/
Checkout his Multi Timeframe Moving Average here :
2)
This indicator also have Bollingger Band. User have option to turn it on / off. User can use it as a target price if all the EMAs below the candle.
Example :
3)
This indicator also shown 52 Weeks High & 52 Weeks Low. User have option to turn it on / off. Their price also shown at the info panel.
Example :
4)
Crossover Signal. This crossover is default, it happen when candle close on top / near timeframe 5Minutes is (Ready). While candle close below timeframe 5Minutes is (Caution). User can choice other shape if they don't want the text label. To change the crossover for other setup, user can change it under = #2. The crossover only shown in past 10 candle.
Example :
Feel free to use it & comment. Thanks.
Nota Keluaran
5)New update (30 January 2022) :
Addon star signal. To help traders aware of long / swing position in daily chart.
Signal appear when current price crossover Moving Average 20 (MA)/weekly, plus crossover Moving Average Exponential 10(EMA)/Daily & crossover Moving Average 50(MA)/Daily.
If not meet this 3 criteria. Signal will not shown.
Example :
Nota Keluaran
New update (24 February 2022) :2 Add on
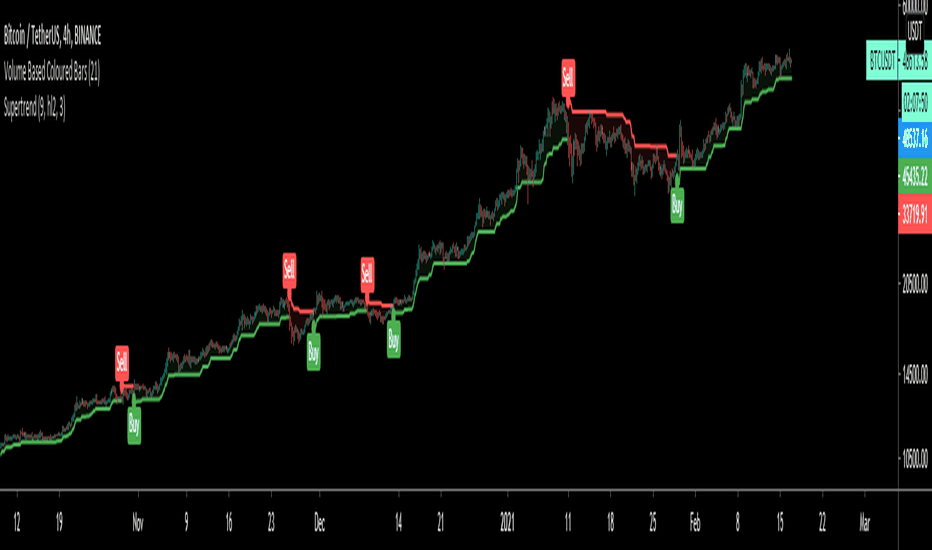
1) ATR Line
2) Label for 52Week High
1) ATR Line.
Green (Start) New Start for uptrend
Red (End) New Start for downtrend
Also Add on value for each signal.
Example :
I am inspired from : tradingview.com/u/KivancOzbilgic/
Check out his Supertrend here :
2) 52Week High Label.
The Idea is to find price that tried to breakout 52Weeks High & as a signal if the price are doing pullback.
Example :
Nota Keluaran
New update (25 August 2022) :Add :
1) EMA Line with info for 2hour.
Remove :
1) ATR Line - To make indicator focus on multiple moving average for multiple timeframe.
Change :
Crossover Signal - From wording change to flag simbols.
Nota Keluaran
Update (9/9/2022)1) Addon tooltips on setting
2) Make it more clean on setting
3) Add on Alert for Reversal
4) Add reversal signal & bar color base on Bollinger Band :
- Bullish Signal = Candle went out lower band AND red candle AND came back in AND green candle (Lime "R")
- Bearish Signal = Candle went out upper band AND green candle AND came back in AND red candle (Yellow "R")
- Show Check (✓) = As comfirmation - close above/below candle wick
This signal I get inspire from StrategicalCharts : tradingview.com/u/StrategicalCharts/
Check out his indicator here :

Skrip dilindungi
Skrip ini diterbitkan sebagai sumber tertutup. Akan tetapi, anda boleh menggunakannya dengan percuma dan tanpa had – ketahui lebih lanjut di sini.
Penafian
Maklumat dan penerbitan adalah tidak dimaksudkan untuk menjadi, dan tidak membentuk, nasihat untuk kewangan, pelaburan, perdagangan dan jenis-jenis lain atau cadangan yang dibekalkan atau disahkan oleh TradingView. Baca dengan lebih lanjut di Terma Penggunaan.