Multi-Timeframe Continuity Custom Candle ConfirmationMulti-Timeframe Continuity Custom Candle Confirmation
Overview
The Timeframe Continuity Indicator is a versatile tool designed to help traders identify alignment between their current chart’s candlestick direction and higher timeframes of their choice. By coloring bars on the current chart (e.g., 1-minute) based on the directional alignment with selected higher timeframes (e.g., 10-minute, daily), this indicator provides a visual cue for confirming trends across multiple timeframes—a concept known as Timeframe Continuity. This approach is particularly useful for day traders, swing traders, and scalpers looking to ensure their trades align with broader market trends, reducing the risk of trading against the prevailing momentum.
Originality and Usefulness
This indicator is an original creation, built from scratch to address a common challenge in trading: ensuring that price action on a lower timeframe aligns with the trend on higher timeframes. Unlike many trend-following indicators that rely on moving averages, oscillators, or other lagging metrics, this script directly compares the bullish or bearish direction of candlesticks across timeframes. It introduces the following unique features:
Customizable Timeframes: Users can select from a range of higher timeframes (5m, 10m, 15m, 30m, 1h, 2h, 4h, 1d, 1w, 1M) to check for alignment, making it adaptable to various trading styles.
Neutral Candle Handling: The script accounts for neutral candles (where close == open) on the current timeframe by allowing them to inherit the direction of the higher timeframe, ensuring continuity in trend visualization.
Table: A table displays the direction of each selected timeframe and the current timeframe, helping identify direction in the event you don't want to color bars.
Toggles for Flexibility: Options to disable bar coloring and the debug table allow users to customize the indicator’s visual output for cleaner charts or focused analysis.
This indicator is not a mashup of existing scripts but a purpose-built tool to visualize timeframe alignment directly through candlestick direction, offering traders a straightforward way to confirm trend consistency.
What It Does
The Timeframe Continuity Indicator colors bars on your chart when the direction of the current timeframe’s candlestick (bullish, bearish, or neutral) aligns with the direction of the selected higher timeframes:
Lime: The current bar (e.g., 1m) is bullish or neutral, and all selected higher timeframes (e.g., 10m) are bullish.
Pink: The current bar is bearish or neutral, and all selected higher timeframes are bearish.
Default Color: If the directions don’t align (e.g., 1m bar is bearish but 10m is bullish), the bar remains the default chart color.
The indicator also includes a debug table (toggleable) that shows the direction of each selected timeframe and the current timeframe, helping traders diagnose alignment issues.
How It Works
The script uses the following methodology:
1. Direction Calculation: For each timeframe (current and selected higher timeframes), the script determines the candlestick’s direction:
Bullish (1): close > open / Bearish (-1): close < open / Neutral (0): close == open
Higher timeframe directions are fetched using Pine Script’s request.security function, ensuring accurate data retrieval.
2. Alignment Check: The script checks if all selected higher timeframes are uniformly bullish (full_bullish) or bearish (full_bearish).
o A higher timeframe must have a clear direction (bullish or bearish) to trigger coloring. If any selected timeframe is neutral, alignment fails, and no coloring occurs.
3. Coloring Logic: The current bar is colored only if its direction aligns with the higher timeframes:
Lime if the higher timeframes are bullish and the current bar is bullish or neutral.
Maroon if the higher timeframes are bearish and the current bar is bearish or neutral.
If the current bar’s direction opposes the higher timeframe (e.g., 1m bearish, 10m bullish), the bar remains uncolored.
Users can disable bar coloring entirely via the settings, leaving bars in their default chart color.
4. Direction Table:
A table in the top-right corner (toggleable) displays the direction of each selected timeframe and the current timeframe, using color-coded labels (green for bullish, red for bearish, gray for neutral).
This feature helps traders understand why a bar is or isn’t colored, making the indicator accessible to users unfamiliar with Pine Script.
How to Use
1. Add the Indicator: Add the "Timeframe Continuity Indicator" to your chart in TradingView (e.g., a 1m chart of SPY).
2. Configure Settings:
Timeframe Selection: Check the boxes for the higher timeframes you want to compare against (default: 10m). Options include 5m, 10m, 15m, 30m, 1h, 2h, 4h, 1D, 1W, and 1M. Select multiple timeframes if you want to ensure alignment across all of them (e.g., 10m and 1d).
Enable Bar Coloring: Default: true (bars are colored lime or maroon when aligned). Set to false to disable coloring and keep the default chart colors.
Show Table: Default: true (table is displayed in the top-right corner). Set to false to hide the table for a cleaner chart.
3. Interpret the Output:
Colored Bars: Lime bars indicate the current bar (e.g., 1m) is bullish or neutral, and all selected higher timeframes are bullish. Maroon bars indicate the current bar is bearish or neutral, and all selected higher timeframes are bearish. Uncolored bars (default chart color) indicate a mismatch (e.g., 1m bar is bearish while 10m is bullish) or no coloring if disabled.
Direction Table: Check the table to see the direction of each selected timeframe and the current timeframe.
4. Example Use Case:
On a 1m chart of SPY, select the 10m timeframe.
If the 10m timeframe is bearish, 1m bars that are bearish or neutral will color maroon, confirming you’re trading with the higher timeframe’s trend.
If a 1m bar is bullish while the 10m is bearish, it remains uncolored, signaling a potential misalignment to avoid trading.
Underlying Concepts
The indicator is based on the concept of Timeframe Continuity, a strategy used by traders to ensure that price action on a lower timeframe aligns with the trend on higher timeframes. This reduces the risk of entering trades against the broader market direction. The script directly compares candlestick directions (bullish, bearish, or neutral) rather than relying on lagging indicators like moving averages or RSI, providing a real-time, price-action-based confirmation of trend alignment. The handling of neutral candles ensures that minor indecision on the lower timeframe doesn’t interrupt the visualization of the higher timeframe’s trend.
Why This Indicator?
Simplicity: Directly compares candlestick directions, avoiding complex calculations or lagging indicators.
Flexibility: Customizable timeframes and toggles cater to various trading strategies.
Transparency: The debug table makes the indicator’s logic accessible to all users, not just those who can read Pine Script.
Practicality: Helps traders confirm trend alignment, a key factor in successful trading across timeframes.
Multipletimeframe

Daily Moving Averages on Intraday ChartsThis moving average script displays the chosen 5 daily moving averages on intraday (minute) charts. It automatically adjusts the intervals to show the proper moving averages.
In a day there are 375 trading minutes from 9:15 AM to 3:30PM in Indian market. In 5 days there are 1875 minutes. For other markets adjust this data accordingly.
If 5DMA is chosen on a five minute chart the moving average will use 375 interval values (1875/5 = 375) of 5minute chart to calculate moving average. Same 5DMA on 25minute chart will use 75 interval values (1875/25 = 75).
On a 1minute chart the 5DMA plot will use 1875 interval values to arrive at the moving average.
Since tradingview only allows 5000 intervals to lookback, if a particular daily moving average on intraday chart needs more than 5000 candle data it won't be shown. E.g 200DMA on 5minute chart needs 15000 candles data to plot a correct 200DMA line. Anything less than that would give incorrect moving average and hence it won't be shown on the chart.
MA crossover for the first two MAs is provided. If you want to use that option, make sure you give the moving averages in the correct order.
You can enhance this script and use it in any way you please as long as you make it opensource on TradingView. Feedback and improvement suggestions are welcome.
Special thanks to @JohnMuchow for his moving averages script for all timeframes.

Stoch RSI and RSI Buy/Sell Signals with MACD Trend FilterDescription of the Indicator
This Pine Script is designed to provide traders with buy and sell signals based on the combination of Stochastic RSI, RSI, and MACD indicators, enhanced by the confirmation of candle colors. The primary goal is to facilitate informed trading decisions in various market conditions by utilizing different indicators and their interactions. The script allows customization of various parameters, providing flexibility for traders to adapt it to their specific trading styles.
Usefulness
This indicator is not just a mashup of existing indicators; it integrates the functionality of multiple momentum and trend-detection methods into a cohesive trading tool. The combination of Stochastic RSI, RSI, and MACD offers a well-rounded approach to analyzing market conditions, allowing traders to identify entry and exit points effectively. The inclusion of color-coded signals (strong vs. weak) further enhances its utility by providing visual cues about the strength of the signals.
How to Use This Indicator
Input Settings: Adjust the parameters for the Stochastic RSI, RSI, and MACD to fit your trading style. Set the overbought/oversold levels according to your risk tolerance.
Signal Colors:
Strong Buy Signal: Indicated by a green label and confirmed by a green candle (close > open).
Weak Buy Signal: Indicated by a blue label and confirmed by a green candle (close > open).
Strong Sell Signal: Indicated by a red label and confirmed by a red candle (close < open).
Weak Sell Signal: Indicated by an orange label and confirmed by a red candle (close < open).
Example Trading Strategy Using This Indicator
To effectively use this indicator as part of your trading strategy, follow these detailed steps:
Setup:
Timeframe : Select a timeframe that aligns with your trading style (e.g., 15-minute for intraday, 1-hour for swing trading, or daily for longer-term positions).
Indicator Settings : Customize the Stochastic RSI, RSI, and MACD parameters to suit your trading approach. Adjust overbought/oversold levels to match your risk tolerance.
Strategy:
1. Strong Buy Entry Criteria :
Wait for a strong buy signal (green label) when the RSI is at or below the oversold level (e.g., ≤ 35), indicating a deeply oversold market. Confirm that the MACD shows a decreasing trend (bearish momentum weakening) to validate a potential reversal. Ensure the current candle is green (close > open) if candle color confirmation is enabled.
Example Use : On a 1-hour chart, if the RSI drops below 35, MACD shows three consecutive bars of decreasing negative momentum, and a green candle forms, enter a buy position. This setup signals a robust entry with strong momentum backing it.
2. Weak Buy Entry Criteria :
Monitor for weak buy signals (blue label) when RSI is above the oversold level but still below the neutral (e.g., between 36 and 50). This indicates a market recovering from an oversold state but not fully reversing yet. These signals can be used for early entries with additional confirmations, such as support levels or higher timeframe trends.
Example Use : On the same 1-hour chart, if RSI is at 45, the MACD shows momentum stabilizing (not necessarily negative), and a green candle appears, consider a partial or cautious entry. Use this as an early warning for a potential bullish move, especially when higher timeframe indicators align.
3. Strong Sell Entry Criteria :
Look for a strong sell signal (red label) when RSI is at or above the overbought level (e.g., ≥ 65), signaling a strong overbought condition. The MACD should show three consecutive bars of increasing positive momentum to indicate that the bullish trend is weakening. Ensure the current candle is red (close < open) if candle color confirmation is enabled.
Example Use : If RSI reaches 70, MACD shows increasing momentum that starts to level off, and a red candle forms on a 1-hour chart, initiate a short position with a stop loss set above recent resistance. This is a high-confidence signal for potential price reversal or pullback.
4. Weak Sell Entry Criteria :
Use weak sell signals (orange label) when RSI is between the neutral and overbought levels (e.g., between 50 and 64). These can indicate potential short opportunities that might not yet be fully mature but are worth monitoring. Look for other confirmations like resistance levels or trendline touches to strengthen the signal.
Example Use : If RSI reads 60 on a 1-hour chart, and the MACD shows slight positive momentum with signs of slowing down, place a cautious sell position or scale out of existing long positions. This setup allows you to prepare for a possible downtrend.
Trade Management:
Stop Loss : For buy trades, place stop losses below recent swing lows. For sell trades, set stops above recent swing highs to manage risk effectively.
Take Profit : Target nearby resistance or support levels, apply risk-to-reward ratios (e.g., 1:2), or use trailing stops to lock in profits as price moves in your favor.
Confirmation : Align these signals with broader trends on higher timeframes. For example, if you receive a weak buy signal on a 15-minute chart, check the 1-hour or daily chart to ensure the overall trend is not bearish.
Real-World Example: Imagine trading on a 15-minute chart :
For a buy:
A strong buy signal (green) appears when the RSI dips to 32, MACD shows declining bearish momentum, and a green candle forms. Enter a buy position with a stop loss below the most recent support level.
Alternatively, a weak buy signal (blue) appears when RSI is at 47. Use this as a signal to start monitoring the market closely or enter a smaller position if other indicators (like support and volume analysis) align.
For a sell:
A strong sell signal (red) with RSI at 72 and a red candle signals to short with conviction. Place your stop loss just above the last peak.
A weak sell signal (orange) with RSI at 62 might prompt caution but can still be acted on if confirmed by declining volume or touching a resistance level.
These strategies show how to blend both strong and weak signals into your trading for more nuanced decision-making.
Technical Analysis of the Code
1. Stochastic RSI Calculation:
The script calculates the Stochastic RSI (stochRsiK) using the RSI as input and smooths it with a moving average (stochRsiD).
Code Explanation : ta.stoch(rsi, rsi, rsi, stochLength) computes the Stochastic RSI, and ta.sma(stochRsiK, stochSmoothing) applies smoothing.
2. RSI Calculation :
The RSI is computed over a user-defined period and checks for overbought or oversold conditions.
Code Explanation : rsi = ta.rsi(close, rsiLength) calculates RSI values.
3. MACD Trend Filter :
MACD is calculated with fast, slow, and signal lengths, identifying trends via three consecutive bars moving in the same direction.
Code Explanation : = ta.macd(close, macdLengthFast, macdLengthSlow, macdSignalLength) sets MACD values. Conditions like macdLine < macdLine confirm trends.
4. Buy and Sell Conditions :
The script checks Stochastic RSI, RSI, and MACD values to set buy/sell flags. Candle color filters further confirm valid entries.
Code Explanation : buyConditionMet and sellConditionMet logically check all conditions and toggles (enableStochCondition, enableRSICondition, etc.).
5. Signal Flags and Confirmation :
Flags track when conditions are met and ensure signals only appear on appropriate candle colors.
Code Explanation : Conditional blocks (if statements) update buyFlag and sellFlag.
6. Labels and Alerts :
The indicator plots "BUY" or "SELL" labels with the RSI value when signals trigger and sets alerts through alertcondition().
Code Explanation : label.new() displays the signal, color-coded for strength based on RSI.
NOTE : All strategies can be enabled or disabled in the settings, allowing traders to customize the indicator to their preferences and trading styles.

Options Series - MTF 1 and 3 Minute
Objective:
The indicator is named "Options Series - MTF 1 and 3 Minute", suggesting it's designed to analyze options series with multiple time frames (MTF), particularly focusing on 1-minute and 3-minute intervals.
OHLC Values Of Candle:
The code fetches the Open, High, Low, and Close (OHLC) values of the current candle for the specified ticker and timeframes (current, 1 minute, and 3 minutes). Additionally, it calculates the 200-period Simple Moving Average (SMA) of the closing prices for each timeframe.
Bull vs. Bear Condition:
It defines conditions for Bullish and Bearish scenarios based on comparing the current close price with the previous 200-period SMA close price for both 1-minute and 3-minute timeframes. If the current close price is higher than the previous 200-period SMA close price, it's considered Bullish, and if it's lower, it's considered Bearish.
Final Color Condition and Plot:
It determines the color of the candlestick based on the Bullish or Bearish condition. If the conditions for a Bullish scenario are met, the candlestick color is set to green (GreenColorCandle). If the conditions for a Bearish scenario are met, the candlestick color is set to red (RedColorCandle). If neither condition is met (i.e., the candle is neither Bullish nor Bearish), the color remains gray.
The code then plots the 200-period SMA values for both 1-minute and 3-minute timeframes and colors them based on the candlestick color. It also colors the bars based on the candlestick color.
Insights:
This indicator focuses on comparing current close prices with the 200-period SMA close prices to determine market sentiment (Bullish or Bearish).
It utilizes multiple time frames (1 minute and 3 minutes) to provide a broader perspective on market movements.
The color-coded candlesticks and bars make it visually easy to identify Bullish and Bearish trends.
This indicator can be used as part trading based on the identified market sentiment.

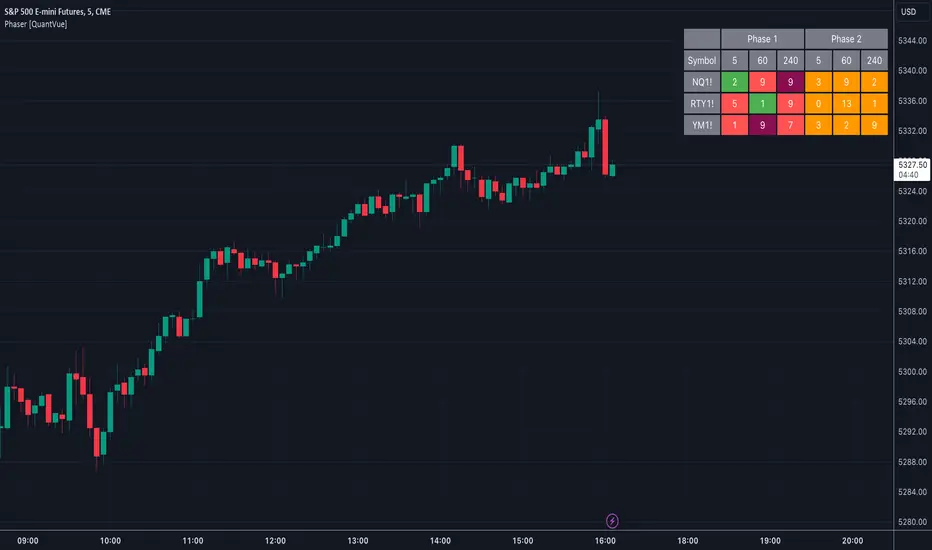
Phaser [QuantVue]The Phaser indicator is a tool to help identify inflection points by looking at price relative to past prices across multiple timeframes and assets.
Phase 1 looks for the price to be higher or lower than the closing price of the bar 4 bars earlier and is complete when 9 consecutive bars meet this criterion.
A completed Phase 1 is considered perfect when the highs (bearish) or lows (bullish) have been exceeded from bars 6 and 7 of the phase.
A bullish setup requires 9 consecutive closes less than the close 4 bars earlier.
A bearish setup requires 9 consecutive closes greater than the close 4 bars earlier.
Phase 2 begins once Phase 1 has been completed. Phase 2 compares the current price to the high or low of two bars earlier.
Unlike Phase 1, Phase 2 does not require the count to be consecutive.
Phase 2 is considered complete when 13 candles have met the criteria.
An important aspect to Phase 2 is the relationship between bar 13 and bar 8.
To ensure the end of Phase 2 is in line with the existing trend, the high or low of bar 13 is compared to the close of bar 8.
A bullish imperfect 13 occurs when the current price is less than the low of 2 bars earlier, but the current low is greater than the close of bar 8 in Phase 2.
A bearish imperfect 13 occurs when the current price is greater than the high of 2 bars earlier, but the current high is less than the close of bar 8 in Phase 2.
Phase 2 does not need to go until it is complete. A Phase 2 can be canceled if the price closes above or below the highest or lowest price from Phase 1.
Settings
3 Tickers
3 Timeframes
Show Phase 1
Show Phase 2
User-selected colors
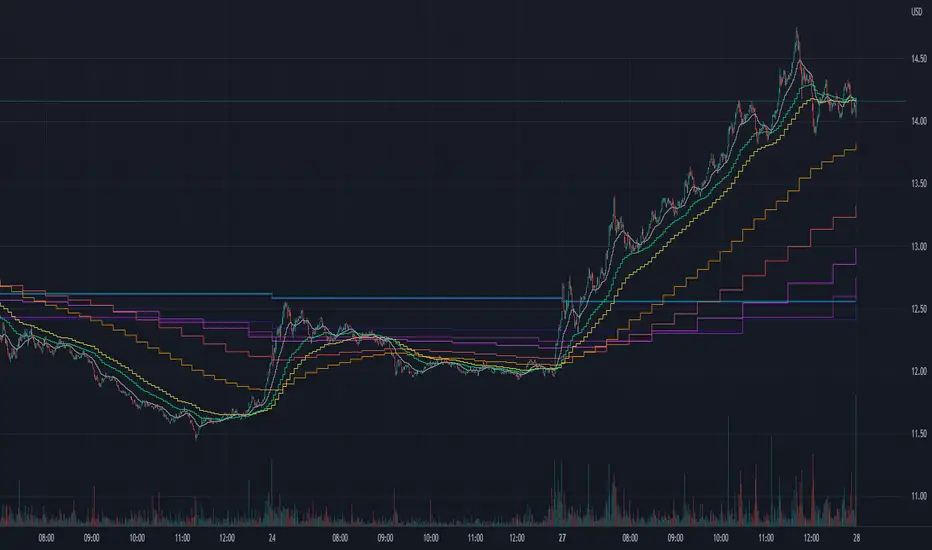
@tk · fractal emas█ OVERVIEW
This script is an indicator that plots short, medium and long moving averages for multiple fractals. This script was based on sharks EMAs by rlvs indicator, that plots multiple rays for each fractals into the chart. The main feature of this indicator is the customizability. The calculation itself is simple as moving average.
█ MOTIVATION
The trader can customize all aspects of the plotted data. The text size, extended line length, the moving average type — exponential, simple, etc... — the length of fractal rays, line style, line width and visibility. To keep minimalist, this indicator simplifies the logic of line colors based on the purpose of each moving averages. To prevent overnoise the chart with multiple lines with multiple colors for each fractal timefraes, the trader needs to keep in mind that the all lines with the "short" moving average color for example, will represents the short moving averages lines for all fractals. This logic is applied for medium and long moving averages either.
█ CONCEPT
The trading concept to use this indicator is to make entries on uptrend or downtrend pullbacks when the asset price reaches the short, medium or long moving averages price levels. But this strategy don't works alone. It needs to be aligned together with others indicators like RSI, Chart Patterns, Support and Resistance, and so on... Even more confluences that you have, bigger are your chances to increase the probability for a successful trade. So, don't use this indicator alone. Compose a trading strategy and use it to improve your analysis.
█ CUSTOMIZATION
This indicator allows the trader to customize the following settings:
GENERAL
Text size
Changes the font size of the labels to improve accessibility.
Type: string
Options: `tiny`, `small`, `normal`, `large`.
Default: `small`
SHORT
Type
Select the Short Moving Average calculation type.
Type: string
Options: `EMA`, `SMA`, `HMA`, `VWMA`, `WMA`.
Default: `EMA`
Length
Changes the base length for the Short Moving Average calculation.
Type: int
Default: 12
Source
Changes the base source for the Short Moving Average calculation.
Type: float
Default: close
Color
The base color that will represent the Short Moving Average.
Type: color
Default: color.rgb(255, 235, 59) (yellow)
Fractal Style
The fractal ray line style.
Type: string
Options: `dotted`, `dashed`, `solid`.
Default: `dotted`
Fractal Width
The fractal ray line width.
Type: string
Options: `1px`, `2px`, `3px`, `4px`.
Default: `1px`
Fractal Ray Length
The fractal ray line length.
Type: int
Default: 12
MEDIUM
Type
Select the Medium Moving Average calculation type.
Type: string
Options: `EMA`, `SMA`, `HMA`, `VWMA`, `WMA`.
Default: `EMA`
Length
Changes the base length for the Medium Moving Average calculation.
Type: int
Default: 26
Source
Changes the base source for the Medium Moving Average calculation.
Type: float
Default: close
Color
The base color that will represent the Short Moving Average.
Type: color
Default: color.rgb(0, 230, 118) (lime)
Fractal Style
The fractal ray line style.
Type: string
Options: `dotted`, `dashed`, `solid`.
Default: `dotted`
Fractal Width
The fractal ray line width.
Type: string
Options: `1px`, `2px`, `3px`, `4px`.
Default: `1px`
Fractal Ray Length
The fractal ray line length.
Type: int
Default: 12
LONG
Type
Select the Long Moving Average calculation type.
Type: string
Options: `EMA`, `SMA`, `HMA`, `VWMA`, `WMA`.
Default: `EMA`
Length
Changes the base length for the Long Moving Average calculation.
Type: int
Default: 200
Source
Changes the base source for the Long Moving Average calculation.
Type: float
Default: close
Color
The base color that will represent the Short Moving Average.
Type: color
Default: color.rgb(255, 82, 82) (red)
Fractal Style
The fractal ray line style.
Type: string
Options: `dotted`, `dashed`, `solid`.
Default: `dotted`
Fractal Width
The fractal ray line width.
Type: string
Options: `1px`, `2px`, `3px`, `4px`.
Default: `1px`
Fractal Ray Length
The fractal ray line length.
Type: int
Default: 12
VISIBILITY
Show Fractal Rays · (Short)
Shows short moving average fractal rays.
Type: bool
Default: true
Show Fractal Rays · (Medium)
Shows short moving average fractal rays.
Type: bool
Default: true
Show Fractal Rays · (Long)
Shows short moving average fractal rays.
Type: bool
Default: true
█ FUNCTIONS
The script contains the following functions:
`fn_labelizeTimeFrame`
Labelize timeframe period in minutes and hours.
Parameters:
tf: (string) Timeframe period to be labelized.
Returns: (string) Labelized timeframe string.
`fn_builtInLineStyle`
Converts simple string to built-in line style variable value.
Parameters:
lineStyle: (string) The line style simple string.
Returns: (string) Built-in line style string value.
`fn_builtInLineWidth`
Converts simple pixel string to line width number value.
Parameters:
lineWidth: (string) The line width pixel simple string.
Returns: (string) Built-in line width number value.
`fn_requestFractal`
Requests fractal data based on `period` given an expression.
Parameters:
period: (string) The period timeframe of fractal.
expression: (series float) The expression to retrieve data from fractal.
Returns: (mixed) A result determined by `expression`.
`fn_plotRay`
Plots line after chart bars.
Parameters:
y: (float) Y axis line position.
label: (string) Label to be ploted after line.
color: (color) Line and label color.
length: (int) Line length.
show: (bool) Flag to display the line. (default: `true`)
lineStyle: (string) Line style to be applied. (default: `line.style_dotted`)
lineWidth: (int) Line width. (default: `1`)
Returns: void
`fn_plotEmaRay`
Plots moving average line for a specific period.
Parameters:
period: (simple string) Period of fractal to retrieve
expression: (series float) The expression to retrieve data from fractal.
color: (color) Line and label color.
length: (int) Line length. (default: `12`)
show: (bool) Flag to display the line. (default: `true`)
lineStyle: (string) Line style to be applied. (default: `line.style_dotted`)
lineWidth: (string) Line width. (default: `1px`)
Returns: void
`fn_plotExtendedEmaRay`
Draws extended line for current timeframe moving average.
Parameters:
coordY: (float) Extended line Y axis position.
textValue: (simple string) Extended line label text.
textColor: (color) Extended line text color.
length: (int) Extended length. (default: `5`)
Returns: void

@tk · fractal rsi levels█ OVERVIEW
This script is an indicator that helps traders to identify the RSI Levels for multiple fractals wherever the current timeframe is. This script was based on RSI Levels, 20-30 & 70-80 by abdomi indicator, that calculates the Relative Strenght Index levels based on the asset's price and plots it into the chart, creating a "wave" style indicator. The core feature of this indicator is the fractal rays, so trader can visualize each of the oversold and overbought levels of multiple timeframe on the current timeframe that he is on. The indicator will plots multiple rays after the chart bars. indicating where is the oversold and overbought levels for others fractals.
█ MOTIVATION
Since the RSI Levels, 20-30 & 70-80 by abdomi indicator helps a lot to identify the possible price levels when the asset is oversold or overbought, I saw myself drawing multiple horizontal lines on these levels in lower timeframes so, in an uptrend or downtrend, I can try to get a pullback of these trends when the asset reaches oversold or overboght levels. So, I get the idea to make those lines visible in multiple timeframes so I don't need to draw it myself manually anymore.
█ CONCEPT
The trading concept to use this indicator is the concept to make entries on uptrend or downtrend pullbacks when the asset price reaches oversold or overbought levels. But this strategy don't works alone. It needs to be aligned together with others indicators like Exponential Moving Averages, Chart Patterns, Support and Resistance, and so on... Even more confluences that you have, bigger are your chances to increase the probability for a successful trade. So, don't use this indicator alone. Compose a trading strategy and use it to improve your analysis.
█ CUSTOMIZATION
This indicator allows the trader to customize the following settings:
GENERAL
Text size
Changes the font size of the labels to improve accessibility.
Type: string
Options: `tiny`, `small`, `normal`, `large`.
Default: `small`
RSI LEVELS · SETTINGS
Pre-oversold Level
Changes the RSI Level to calculate the "pre-oversold" price level on the chart.
Type: int
Min: 1
Max: 49
Default: 33
Pre-overbought Level
Changes the RSI Level to calculate the "pre-overbought" price level on the chart.
Type: int
Min: 51
Max: 100
Default: 67
Show "Pre-over" Levels
Enables / Disables the pre-oversold and pre-overbought levels on the chart.
Type: bool
Default: true
FRACTAL RAYS · SETTINGS
Length
Changes the base length for the RSI calculation.
Type: int
Min: 1
Default: 14
Source
Changes the base source for the RSI calculation.
Type: float
Default: close
FRACTAL RAYS · STYLE
Ray Color
Changes the color of all fractal rays and its label.
Type: color
Default: color.rgb(187, 74, 207)
Ray Style
Changes the style of all fractal rays.
Type: string
Options: `line.style_solid`, `line.style_dashed`, `line.style_dotted`
Default: line.style_dotted
Ray Length
Changes the length of all fractal rays.
Type: int
Default: 15
FRACTAL RAYS · OVERSOLD
Oversold Level
Changes the base RSI Level for fractal rays calculation.
Type: int
Min: 1
Default: 30
Oversold Prefix
Customizes the fractal ray label with a prefix text.
Type: string
Default: 🚀
Oversold Suffix
Customizes the fractal ray label with a suffix text.
Type: string
Default: (empty)
FRACTAL RAYS · OVERBOUGHT
Overbought Level
Changes the base RSI Level for fractal rays calculation.
Type: int
Min: 1
Default: 70
Overbought Prefix
Customizes the fractal ray label with a prefix text.
Type: string
Default: 🐻
Overbought Suffix
Customizes the fractal ray label with a suffix text.
Type: string
Default: (empty)
FRACTAL RAYS · VISIBILITY RULES
These rules are applied for each of fractal rays so, the traders can choose what timeframes they wants to show the fractal rays for each of it. The rule will be applied as the following condition: `if timeframe != CURRENT_TIMEFRAME and timeframe <= CHOSEN_OPTION`. Actually, the fractal rays are on the chart but, isn't visible because it was applied a transparent color, so it is visually not on the chart to prevent chart's over polution.
LABELS
Show Labels on Price Scale
Shows labels on price scale.
Type: bool
Default: false
Show Price on Fractal Rays
Shows the RSI Level price on each of fractal rays respectively.
Type: bool
Default: false
█ EXTERNAL LIBRARIES
This script uses the `tk` library to calculate RSI Levels. It is a library that contains various functions that helps pine script developers to calculate RSI Levels.
█ FUNCTIONS
The library contains the following functions:
fn_fractalVisibilityRule(string visibilityRule)
Converts the fractal rays timeframe visibility rule label to timestamp int.
Parameters:
visibilityRule: (string) Fractal ray visibility rule label.
Returns: (int) Fractal ray visibility rule timestamp.
fn_requestFractal(string period, expression)
Converts the fractal rays timeframe visibility rule label to timestamp int.
Parameters:
period: (string) Timeframe period for the desired fractal.
expression: (mixed) Security expression that will be applied for calculation.
Returns: (mixed) A result determined by expression.
fn_plotRay(float y, string label, color color, int length)
Plots ray after chart bars for the current time.
Parameters:
period: (string) Timeframe period for the desired fractal.
expression: (mixed) Security expression that will be applied for calculation.
Returns: (void) This function only plots the elements into the chart
fn_plotRsiLevelRay(simple string period, simple int level, color color)
Plots RSI Levels ray after chart bars for the current time.
Parameters:
period: (simple string) Timeframe period.
level: (simple int) Relative Strength Index level.
color: (color) The color of both, ray and label text.
Returns: (void) This function only plots the elements into the chart

RSI MTF DashboardThis is an RSI dashboard, which allows you to see the current RSI value for five timeframes across up to 8 tickers of your choice. This is a useful tool to gauge momentum across multiple timeframes, where you would look to enter a buy with high RSI values across the timeframes (and vice versa for sell positions).
Conversely, some traders use RSI to identify potential areas for reversals, so you would look to buy with low RSI values (and vice versa for sell positions).
In the settings, please select which 5 timeframes you require. Then select which tickers you wish to see, and you will find a dashboard on your chart to show the RSI values. The dashboard can be highlighted when the RSI value shows bearish momentum (a value under 50, of your choice) and bullish momentum (a value over 50, again of your choice). These colours and values are fully customisable.
In the settings you can also select the location of the dashboard, as well as some colour and transparency settings to enable the best possible view on screen.

HARSI + Divergences// All credit to © //@author=JayRogers & VuManChu Cipher B for their original Scripts (Open Source)
/ ====== ABOUT THIS INDICATOR
// I've combined some part of the code of the following indicators to get some alerts based on the Idea and Use section below :
// - RSI based Heikin Ashi candle oscillator
// - Divergence based on the VuManChu Cipher B
//
// ====== ARTICLES and FURTHER READING
//
// - www.investopedia.com
//
// "Heikin-Ashi is a candlestick pattern technique that aims to reduce
// some of the market noise, creating a chart that highlights trend
// direction better than typical candlestick charts"
//
// ====== IDEA AND USE
// - The use of the HA RSI indicator when in the OverSold and OverBought
// area combined to a Divergence & a OB/OS buy/sell
// on the Cipher B by VuManChu.
// Can be useful as a confluence at S/R levels.
// *** Tip = 1 minute timeframe seems to work the best on FOREX
//
// *** Alerts :
// - The Divergence alert needs 2 bar to calculate,
// so alerts and dots as well, it will be placed on the right spot on
// the chart as per the offset added.
// - Use "Once Per Bar" for the alert, not per bar close, or you would
// have 1 extra bar delay
//
// ** Contributions : Remodel some part of the original script in order to get :
// --> Total conditions for an alert and a dot to display, resumed :
// - Buy/Sell in OB/OS
// - Divergence Buy/Sell
// - RSI Overlay is in OB/OS on current bar (or was the bar before)
// when both Buy/Sell dots from VMC appears.
//
// ====== DISCLAIMER
// For Tradingview & Pinescript moderators =
// This follow a strategy where RSI Overlay from @JayRogers script shall be
// in OB/OS zone, while combining it with the VuManChu Cipher B Divergences
// Buy&Sell + Buy/sell alerts In OB/OS areas.
// Any trade decisions you make are entirely your own responsibility.
//
// Thanks to dynausmaux for the code
// Thanks to falconCoin for inspired me to start this.
// Thanks to LazyBear for WaveTrend Oscillator
// Thanks to RicardoSantos for

OHLC MTFThe script allows you to plot the opening, highest, lowest and closing (ohlc) values of a previous candle.
Settings :
- "Time Frame" : allows you to choose the reference time frame;
- "Offset" : sets which candle to select the data from.
Ex : If you select "1 day" as the time frame and "1" as the offset, the OHLC values of yesterday's daily candle will be displayed (regardless of your current time frame).

Regression Channel Alternative MTF█ OVERVIEW
This indicator displays 3 timeframes of parallel channel using linear regression calculation to assist manual drawing of chart patterns.
This indicator is not true Multi Timeframe (MTF) but considered as Alternative MTF which calculate 100 bars for Primary MTF, can be refer from provided line helper.
The timeframe scenarios are defined based on Position, Swing and Intraday Trader.
█ INSPIRATIONS
These timeframe scenarios are defined based on Harmonic Trading : Volume Three written by Scott M Carney.
By applying channel on each timeframe, MW or ABCD patterns can be easily identified manually.
This can also be applied on other chart patterns.
█ CREDITS
Scott M Carney, Harmonic Trading : Volume Three (Reaction vs. Reversal)
█ TIMEFRAME EXPLAINED
Higher / Distal : The (next) longer or larger comparative timeframe after primary pattern has been identified.
Primary / Clear : Timeframe that possess the clearest pattern structure.
Lower / Proximate : The (next) shorter timeframe after primary pattern has been identified.
Lowest : Check primary timeframe as main reference.
█ EXAMPLE OF USAGE / EXPLAINATION

+ Multi-timeframe Multiple Moving Average LinesThis is a pretty simple script that plots lines for various moving averages (what I think are the most commonly used across all markets) of varying lengths of timeframes of the user's choosing. Timeframes range from 5 minutes up to one month, so regardless if you're a scalper or a swing trader there should be something here for you.
There are 8 lines (that can be turned on/off individually), which may seem like a lot, but if you use two averages and want to display four different timeframes for each, you can do that. The nice thing is that because the lines start plotting from the current bar they won't clutter up the screen. And obviously having moving averages from different timeframes on your chart makes price action more difficult to read (I mean sure, you can make them invisible, but who wants to do that all the time).
For each line there are two labels. One with the moving average type, and the other with its specific timeframe. I can't include the moving average length because it's not a string input. If anyone has a workaround for this, let me know, otherwise I would simply recommend setting different colors depending on the length, or if you only use one or two lengths and one or two moving averages this shouldn't be an issue. I had to use two labels because for the label text I couldn't include more than one string input, this is why there is an input for the 'moving average type label distance.'' You will want to adjust this depending on if you are trading crypto, futures, or forex because in some cases there may still be label overlap.
Pretty much everything else is self-explanatory.
I've added alerts. I might need to modify them if I can, because it would be nice for them to state the name and timeframe of the moving average. But I think this will do for now.
Enjoy!

Multi-timeframe MomentumThe Multi-timeframe momentum indicator is similar in concept to a velocity indicator like rate-of-change, but visualizes smoothed price changes by applying an EMA and linear regression to price difference at every bar. Momentums from 1 minute to 1 quarter are plotted on a single chart using the request.security function. Standard and Fibonacci timeframes are available as well as the ability to hide high-timeframes to keep the chart clean. Like any oscillator, divergence in the momentums can be used to identify price reversals in conjunction with support and resistance. When linear regression is applied, high and low inflection points are used to identify reversals in a manner similar to MACD.
Much love to DumpCap! The script is presented sans secret sauce.

Multi-timeframe EMAThe Multi-timeframe exponential moving average (EMA) indicator visualizes EMAs from 1 minute to 1 quarter on a single chart using the request.security function. Standard and Fibonacci timeframes are available as well as the ability to hide high-timeframe EMAs to keep the chart clean. Cross-overs and arrangement of the EMAs indicate sentiment.
Much love to DumpCap! The script is presented sans secret sauce.
2TimeFrame Candles by EsIstTurnt//Not my original idea, Ive pretty much just doubled the code to have 2 Candles .All Credit goes to the creator of "Multi-Time Period Charts" as I have it saved in my library. I cant find it anymore and searching the script doesn't appear it seems so if its you let me know (and ill credit you). Why did I opt to plot 2 candles you say? 2*candles=(info)*2. 3 if we count the regular plot. Anything more than that and its too busy/blurring to really visualize trends but this was a bit of a game changer no more switching timeframes back and forth .

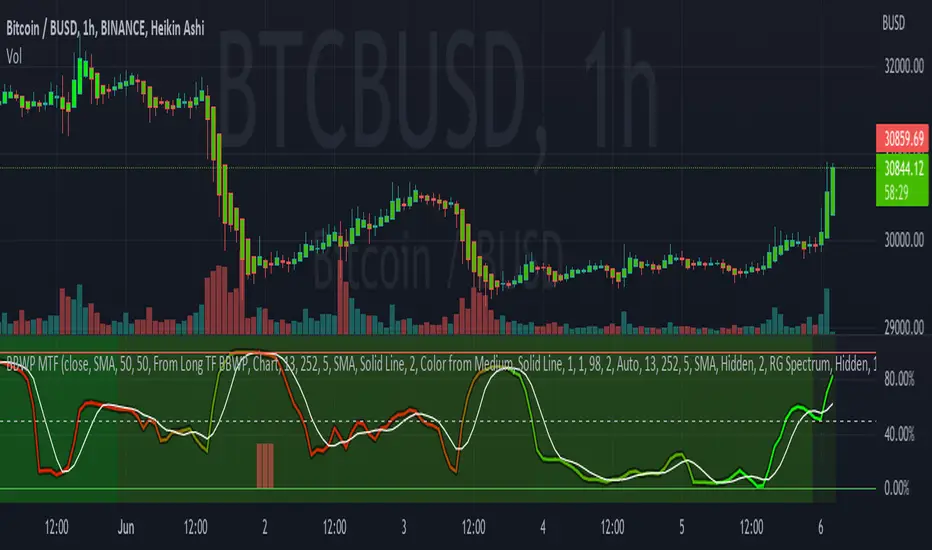
Bollinger Band Width Percentile - Multi Time FrameMy plan with this indicator was when trading at short timeframes, to modify my expectations on the potential impact of short term volatility based on volatility in longer timeframes, and when trading on longer timeframes to attempt to find an optimal entry point based on shorter term volatility.
The BBWP is calculated for a short, medium and long timeframe, alerts are triggered at extremities with the ability to filter by moving averages and chart movement. The alerts also trigger a plot to the "Backtest Signal" which can be used to trigger trades in a backtester.
Please see the discussions of how I'm using this indicator in the comments below.
Thanks to The_Caretaker for "Bollinger Band Width Percentile" upon which this multi time frame version is based.
Take profit Multi timeframeRepublish:
Take profit Multi timeframe:
In this scipts, I build risk-reward system managemant. You can take profit in two way: percent or at resistant in higher timeframe or both.
Strategy in this scripts, I use Wave trend indicator as example strategy.

Multi Timeframe EMA by DigitaldYou can use this indicator to show the Daily-EMAs beside the EMAs of the current timeframe.
Everything can be adjusted
Cheers
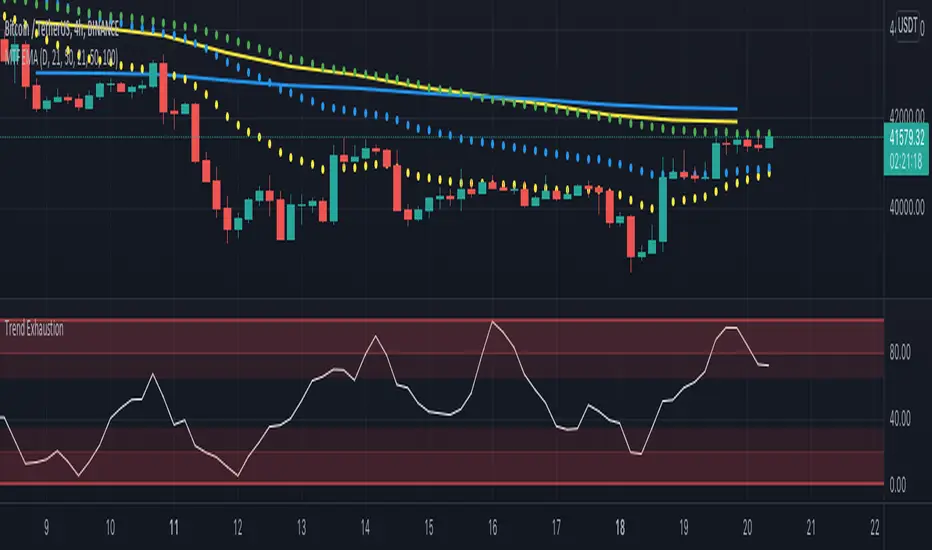
MTF Ichimoku Analysis[tanayroy]Ichimoku can state market conditions better than any indicator or group of indicators(My own perspective). Ichimoku works seamlessly in different timeframes. Analysis of Ichimoku in different timeframes can give you the bigger picture of the market.
This indicator analyzes six different timeframes with Ichimoku in depth. Default timeframes are 5M, 30M, 60M, D, W, and M. You can change the default timeframes from the setting.
As we are dealing with many relations, we can define the relationship with a simple score to get the trend strength.
Ichimoku Analysis:
Relationship of Price(P) with Ichimoku indicators: Here we are analyzing the current price and Ichimoku indicators. The position of price with respect to Ichimoku indicators states the market condition clearly.
Price(P) and Kumo(C): P > C = Bullish (↑). P < C = Bearish (↓). P <> C = consolidation or no trend(↔). Score: ±2
Price(P) and Tenkan Sen(T): P >= T = Bullish (↑). P < T = Bearish (↓). Score: ±0.5
Price(P) and Kijun Sen(K): P >= K = Bullish (↑). P < T = Bearish (↓). Score: ±0.5
Price(26 bars ago) and Chiku(L): L >= P(26) = Bullish (↑). L < P(26) = Bearish (↓). Score: ±0.5
Tenkan Sen and Kijun Sen Relation. Tenkan Sen depicts short-term trends and Kijun depicts mid-term trends. So this relationship is important for analyzing the current trend of the market.
Tenkan Sen(T) and Kijun Sen(K): T >= K = Bullish (↑). T < K = Bearish (↓). Score: ±2
Direction of Ichimoku indicators.
The direction of Ichimoku indicators helps us to understand the trend strength.
Tenkan Sen's(T) direction: Upward slope = Bullish (↑). Downward slope = Bearish (↓). Flat=consolidation or no trend(↔). Score: ±0.5
Kijun Sen's(K) direction: Upward slope = Bullish (↑). Downward slope = Bearish (↓). Flat=consolidation or no trend(↔). Score: ±0.5
Senkou A(A) direction: Upward slope = Bullish (↑). Downward slope = Bearish (↓). Flat=consolidation or no trend(↔). Score: ±0.5
Senkou B(A) direction: Upward slope = Bullish (↑). Downward slope = Bearish (↓). Flat=consolidation or no trend(↔). Score: ±0.5
Cloud and other Ichimoku indicators:
Kumo or Cloud is very important in the Ichimoku system. Analyzing its relation with other indicators is important to detect the overall market condition.
Kumo(C) and Tenkan Sen(T): T >= C = Bullish (↑). T < C = Bearish (↓). T <> C = consolidation or no trend(↔). Score: ±0.5
Kumo(C) and Kijun Sen(K): K >= C = Bullish (↑). K < C = Bearish (↓). K <> C = consolidation or no trend(↔). Score: ±0.5
Kumo(C) and Chiku(L): L >= C = Bullish (↑). L < C = Bearish (↓). L <> C = consolidation or no trend(↔). Score: ±0.5
Kumo(C) Shadow: By analyzing the last 252 bars(you can change this option) we are analyzing the Kumo shadow behind the current price. If Kumo shadow is present behind the price, trend strength will be weakened. Score: ±0.5
Kumo(C) Future (Senkou A(A) and Senkou B(B)): A >= B = Bullish (↑). A < B = Bearish (↓). Score: ±0.5
Chiku(L) Analysis:
Vertical and Horizontal Chiku analysis will tell us about the possible consolidation of the price.
Chiku Vertical: if the price consolidates for the next 5 bars(You can change this option) will it run into the price. Please remember we are placing the current price 26 bars ago and we are interested to see the current price in open space for a clear trend. Score: ±0.5
Chikou Horizontal: If Chiku is in open space (Not running into the price), we want to review Chiku vertically i.e how much percentage of fall or rise of the current price can cause Chiku to run into the price.
So, the maximum trend score is ±10.5.
Ichimoku signals:
We know, that the crossover of Ichimoku indicators provides important signals. In this section, you can see all the crossover i.e when they happened (Bars ago)
Distance between price and Tenkan Sen and Kijun Sen: We know, the price come back to Tenkan/Kijun if it goes far away from Tenkan/Kijun. So it is important to note the distance between Tenkan and Price.
Please note that this indicator is not a strategy or buy/sell signal. It just shows you the picture of Ichimoku in multiple timeframes. I am working on some strategies of Ichimoku and will publish the same when my research is complete.
If you want to analyze Ichimoku in a single timeframe, please review the following indicator.
To maintain the table size you can use the shorthand notation from the setting.
Table with detailed analysis:
Table with shorthand notation:
Please comment if you want any clarification or found any bugs to report.

Ichimoku Buy/Sell Signals of manual MTF Tenkan crossing KijunIchimoku Buy/Sell Signals based on fast, small time frame Tenkans crossing longer timeframes Kijuns - Manual MTF Analysis
This code marks the potential change of direction based on the input of one timeframe's Ichimoku Tenkan (conversion) line crossing over a higher, longer timeframe's Ichimoku Kijun (base) line.
Feel free to change the inputs if need be and to hide the yellow box. Use Ichimoku rules of Tenkan, Kijun, Lagging Span, and Cloud for Take profit/Stop Losses. It is best to wait 3-5 minutes after the signal to enter to confirm the trend and to confirm if the Lagging Span has broken key levels. I refer to the book Trading with Ichimoku - A Practical Guide to Low-Risk Ichimoku Strategies by Karen Peloille as the Ichimoku rulebook. Good luck.
For day trading/scalping/intraday - 1min/3min/5min
Tenkan Line Timeframe = 1min
Kijun Line Timeframe = 5min
For swing trading - multiple days/weeks - 4HR/Daily/Weekly Charts
Tenkan Line Timeframe = day
Kijun Line Timeframe = week

Multi-Timeframe RSI GridThe relative strength index (RSI) is a momentum indicator that measures the magnitude of recent price changes to evaluate overbought or oversold conditions. The RSI is normally displayed as an oscillator separately from price and can have a reading from 0 to 100. This indicator displays the current RSI levels at up to 6 timeframes (of your choosing) in a grid. If the RSI levels reach overbought (above 70) or oversold (below 30) conditions, it changes the color to help you see that RSI has reached extreme levels. Note that in TradingView, when the chart is on a higher timeframe, the lower timeframe RSI levels don't calculate properly. If those conditions are met, this indicator will hide those values in the grid. If none of your selected values are available, it hides the table completely. There are configuration options, like:
Position the grid in any corner of the screen
Style customization (color, size)
Customize RSI length

WaveTrend 4h/24mWaveTrend 4h/24m is a trading tool based on two WaveTrend timeframes.
For this script the WaveTrend calculations made by LazyBear were used. WaveTrend is a widely used indicator for finding direction of an asset.
The strategy is developed by Youtuber Jayson Casper. The main strategy on the 4 hour and 24 minute timeframes, this will be the default timeframes. Timeframes can be adjusted in the indicator interface.
With Jaysons' we wait for both timeframes to have last printed a green dot for longs, and both timeframes to have last printed a red dot for shorts. When this occurs a green diamond will be printed for longs, a red diamond for shorts.
Make sure to always use the chart from the smallest timeframe you're using, so by defaults use the 24 minute chart.
Features of the indicator:
- WaveTrend Timeframe 1 (Blue/Lightblue wave).
- WaveTrend Timeframe 2 (Blue/Purple line with filled background between the lines).
- VWAP (Yellow wave which is turned off by default)
- Green/Red Diamonds
What to look for?
This script is all about the Green and Red Diamonds.
A Green diamond will be printed when on both the 4 hour and 24 minute timeframe the last printed dot was a green dot.
A Red diamond will be printed when on both the 4 hour and 24 minute timeframe the last printed dot was a red dot.
What are the Green and Red Diamonds based on?
When both VWAP timeframes are ABOVE 0, a green diamond will be printed. This is equivalent to the last dot on both WaveTrend timeframes being a green dot.
When both VWAP timeframes are BELOW 0, a red diamond will be printed. This is equivalent to the last dot on both WaveTrend timeframes being a red dot.
Happy Trading!

Hx MTF Moving AverageThis script provides a quick and easy access to different timeframes of a moving average in one indicator and one tab.
It handles up to 4 different timeframes and the current timeframe if it is different from the preset timeframes.
The moving average is not displayed if the current timeframe is higher than the preset timeframe, as per TradingView recommandations.
Available moving average types: sma , wma , ema , vwma , rma (RSI), hma (Hull) and smma (Smoothed).
The default settings provide an example of commonly used timeframes with associated colors ranked from Hot (shorter, more nervous) to Cold (longer, less nervous) while the current timeframe is displayed in gray.
These settings are just an example and are NOT meant to be used as a trading system! DYOR!
